At a glance
- My role
- Senior Product Designer in the product trio, with equal say to the PM. Sole designer from 2025.
- What I was responsible for
- Splitting the work between a verification team (L0) and coders (L1), both of their screens, the verification states, and the surveys that measured them. The first version of the tool (V1), the AI that reads the chart (NLP, natural language processing), the backend and the compliance rules belonged to others.
- What zero looked like
- One coder doing four jobs on every chart: confirm the patient, check each visit, find the evidence, record the diagnosis. The business case put non-coding work at 66% of the day.
- What was at stake
- Risk adjustment coding: the codes decide how much a health plan is paid, so an error has financial and compliance consequences.
- What shipped
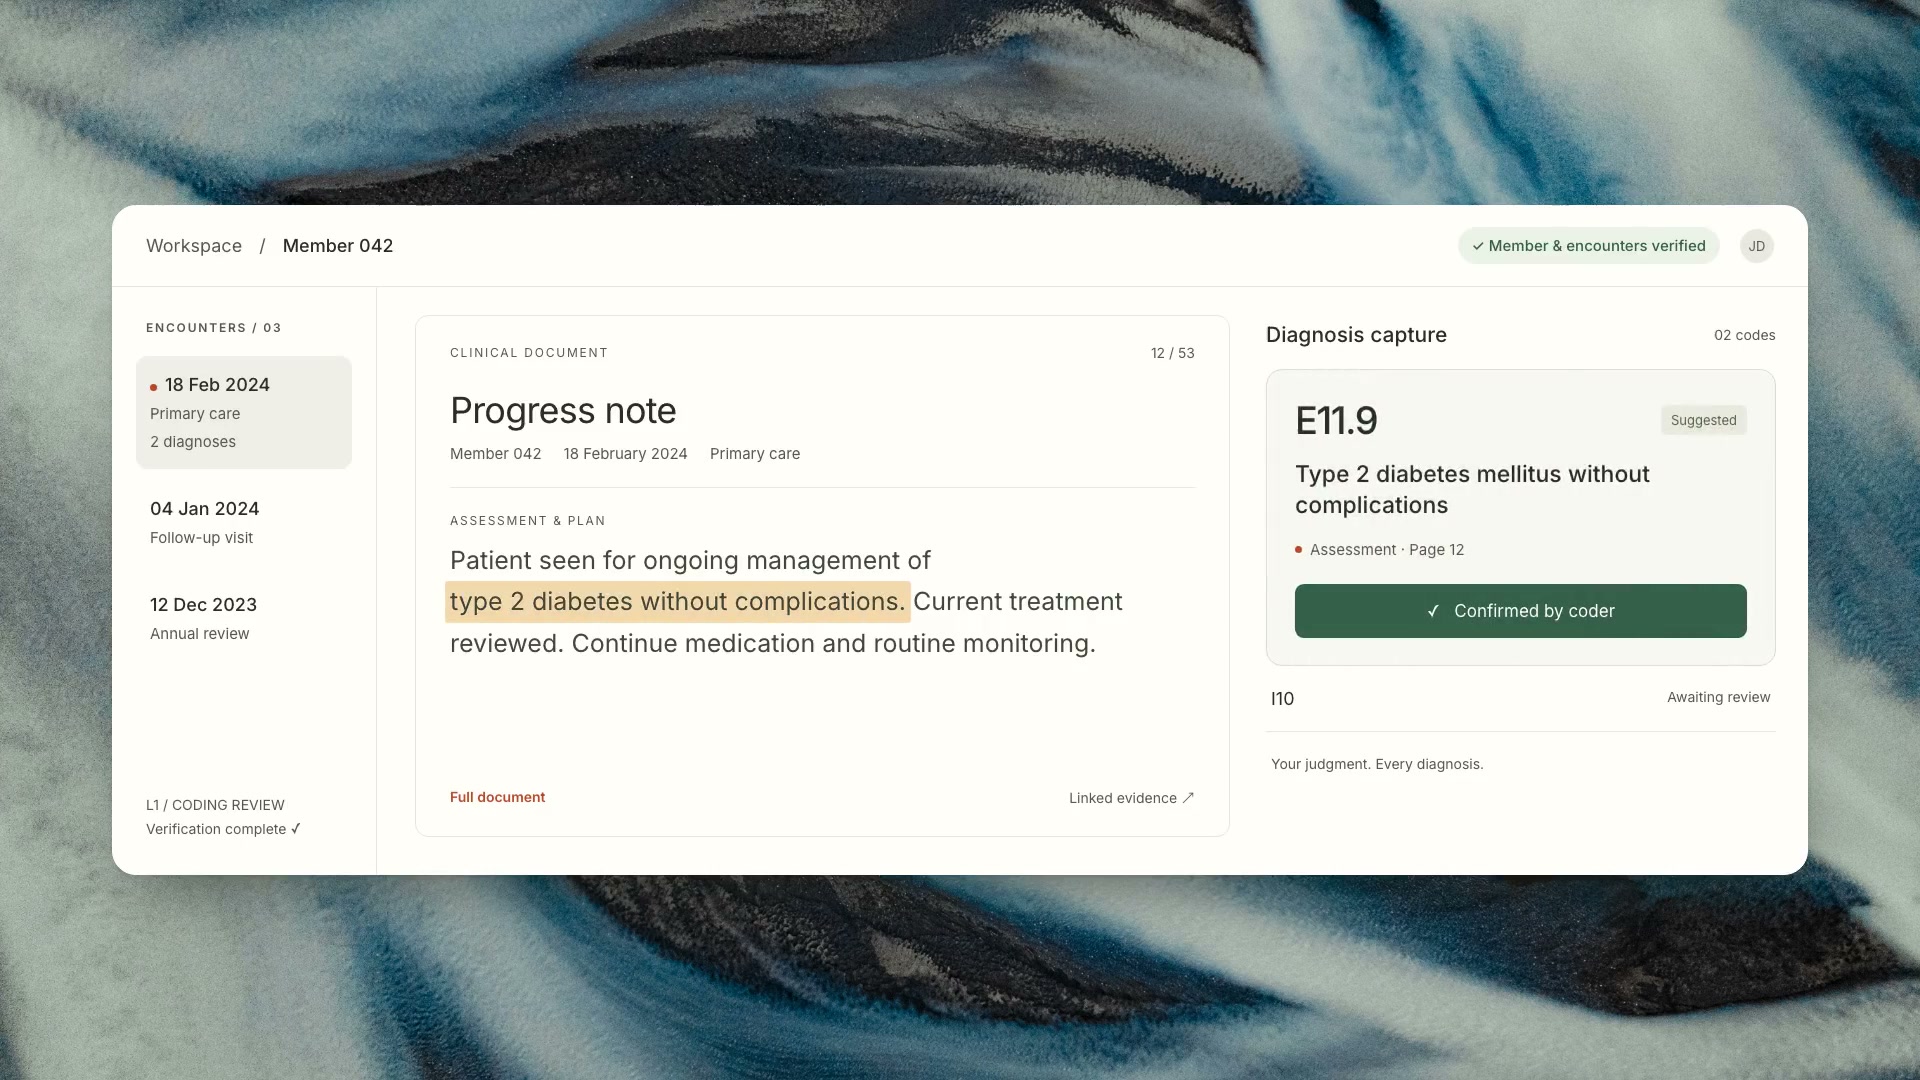
- A verification team (L0) with tools to correct the AI, a coding workspace for coders (L1), banners showing what was checked, a required AI acknowledgment, training guides, and the surveys that measured it.
Impact
- 87.6%Said verification improves coding speedCoders reported. Member verification pilot, n = 887
- 89%Positive ratings, averaged across survey questionsCoders reported. Member verification pilot, n = 887
QA spot checks across 30,000+ charts coded during the pilot found near-zero errors (not a full audit). Survey ratings, not measured speed. See Evidence.
What I noticed
Coders were doing work that wasn't coding.
The idea for the split came from watching coders struggle with the first version of the tool (V1). Before any clinical judgment, they had to confirm the patient on every page, check dates, providers and credentials, and hunt through the chart for evidence. All of it lived on one screen.
Before: every step open at once
Look at: four jobs on one screen. Patient checks, the visit list, the chart, and a pop-up for recording the diagnosis all compete for attention. Every screen in this case study is rebuilt from production. Only the branding and patient data are changed.
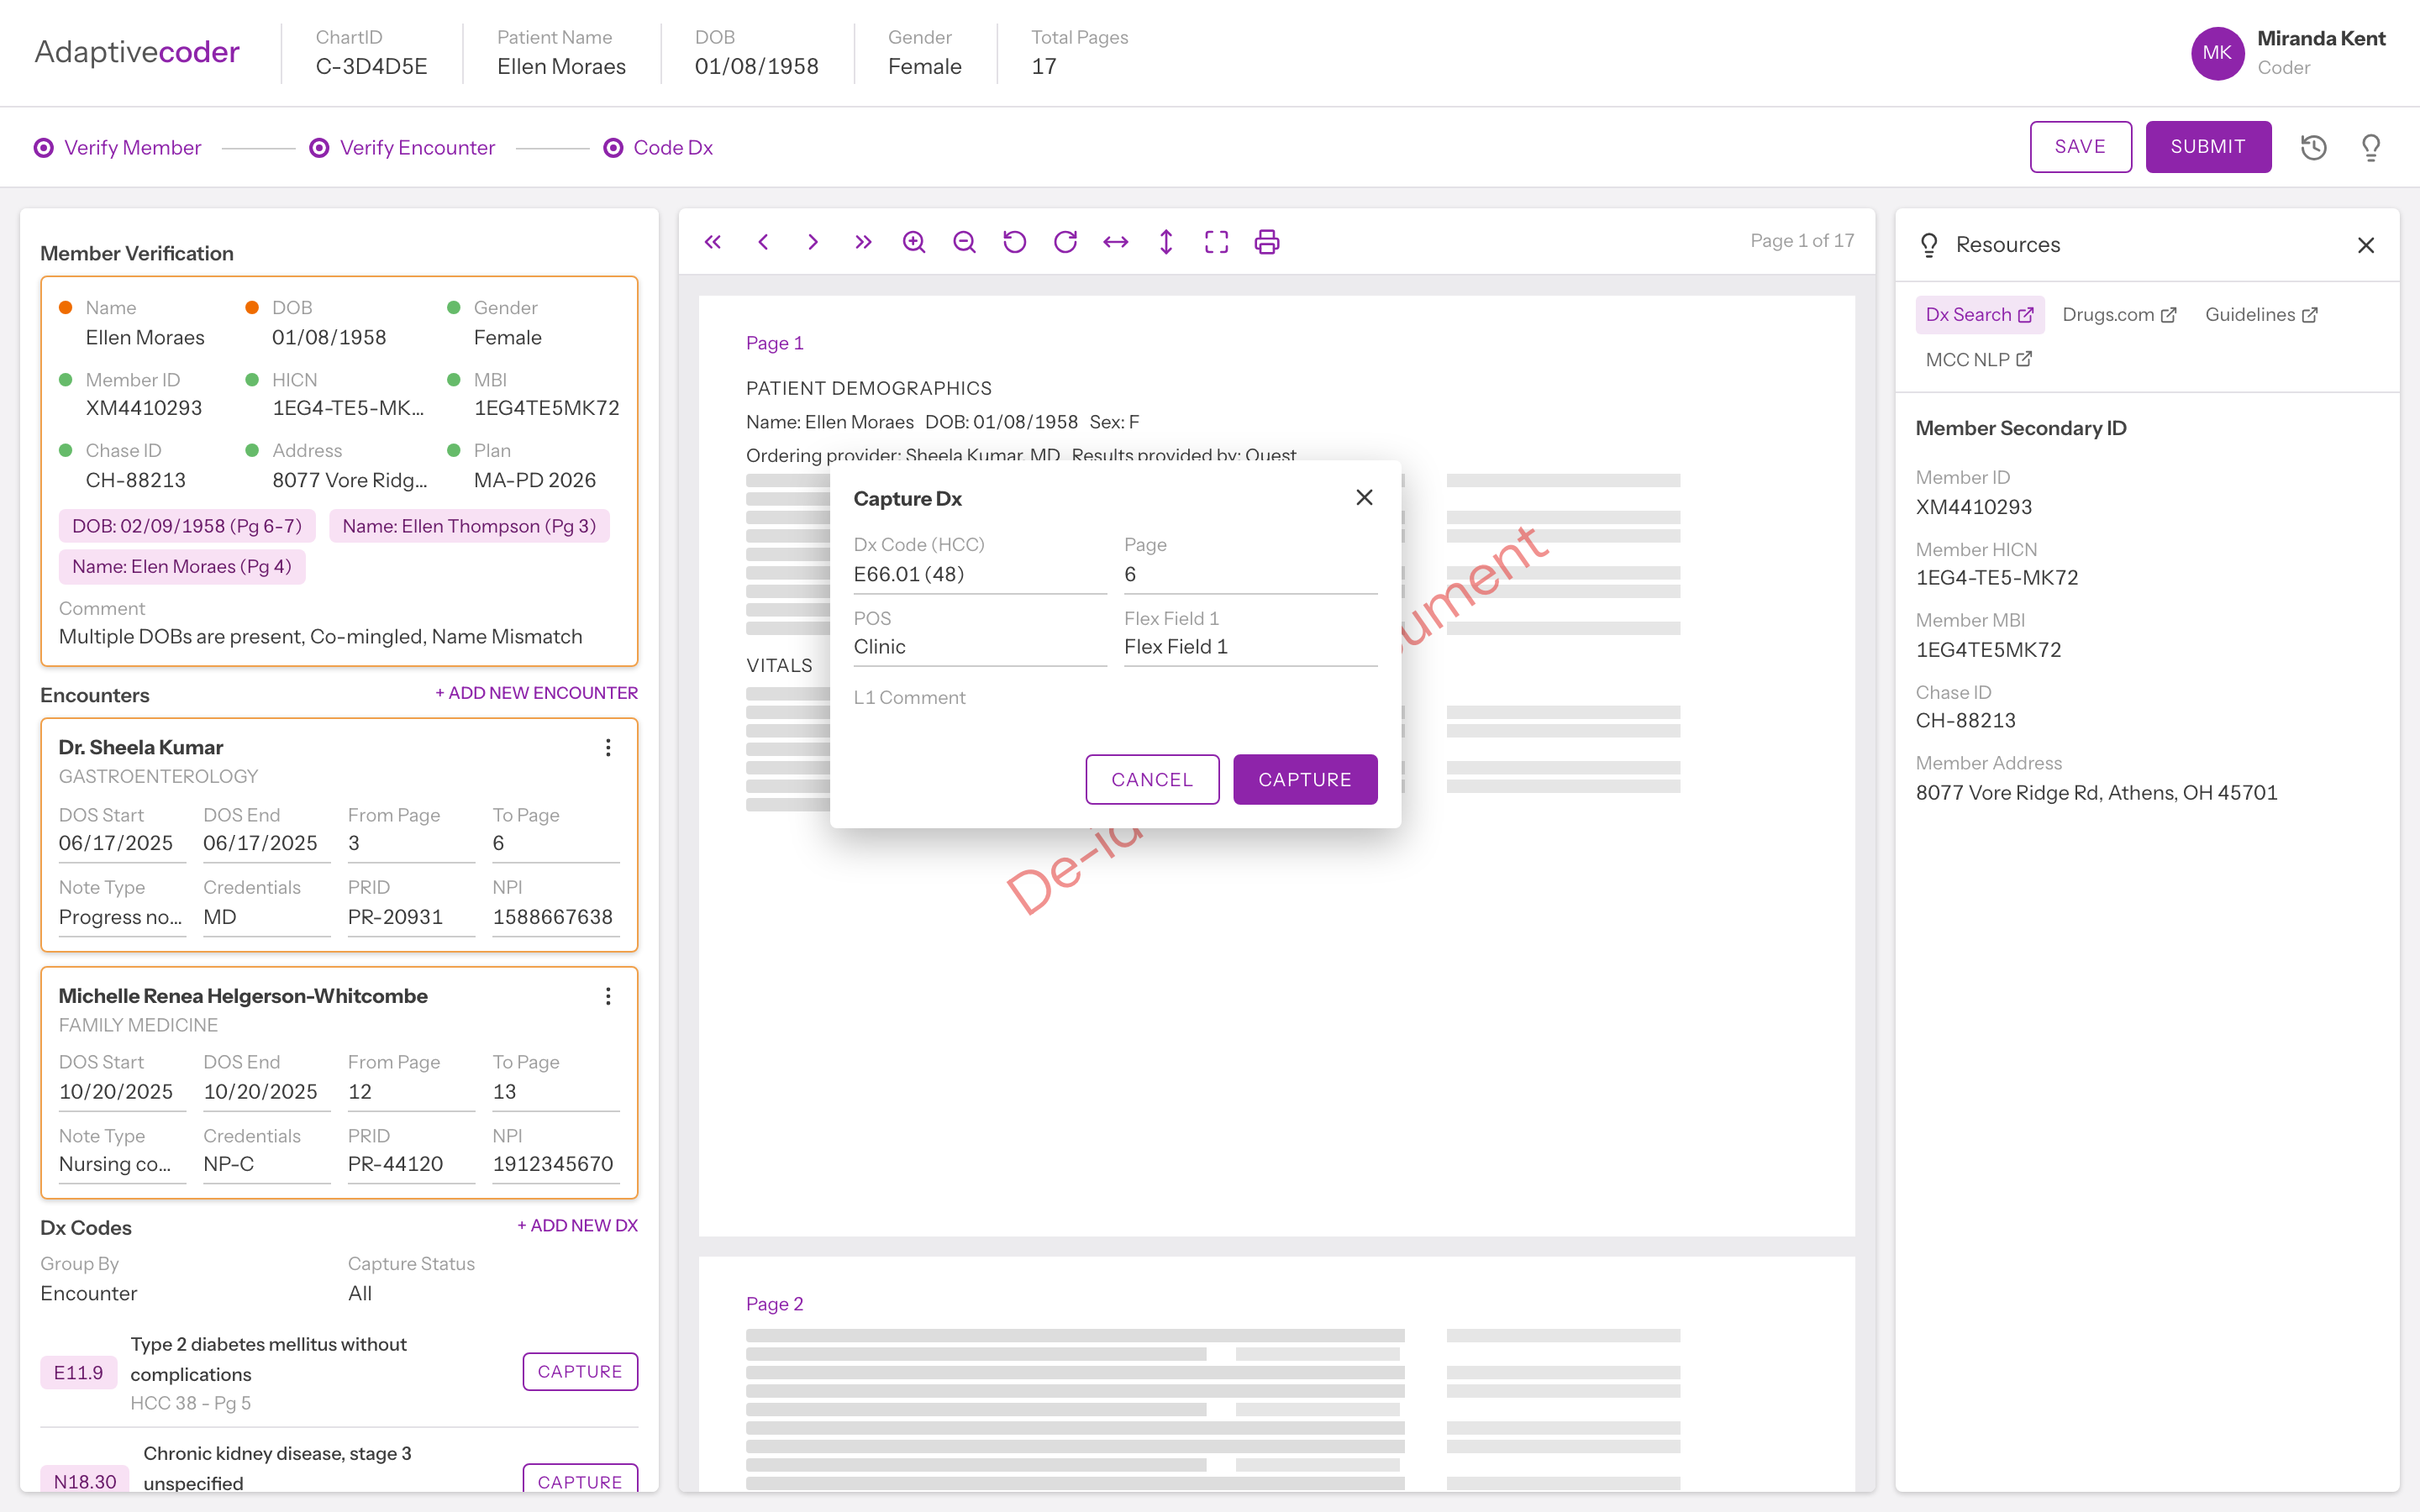
The business case measured the cost, against a goal of 100M charts a year from 10K coders by 2026, at 38 charts per coder a day. Those figures are the organisation's, not my measurements. It told me the problem was real; it didn't tell me what to build.
Confirmed by the business caseTwo-thirds of a coder's day went to scrolling and checking the chart, before any medical coding began.
My first instinct was speed: remove clicks, shorten the path. Then I asked a more basic question. What jobs is a coder actually doing on this screen?
The answer was two jobs with different mental models.
Two jobs, two ways of thinking, one V1 screen
Both crops come from the Before screen above. Asking one person to switch between them on every page was the real cost.
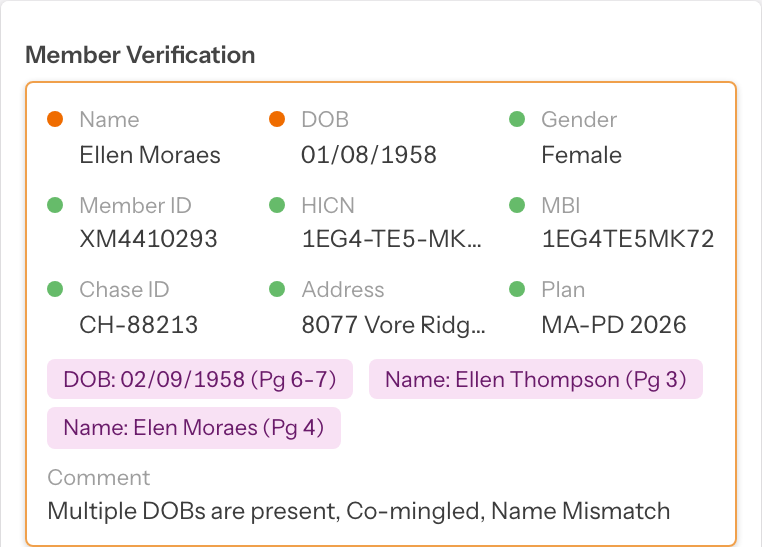
Matching. Does this page agree with that record?
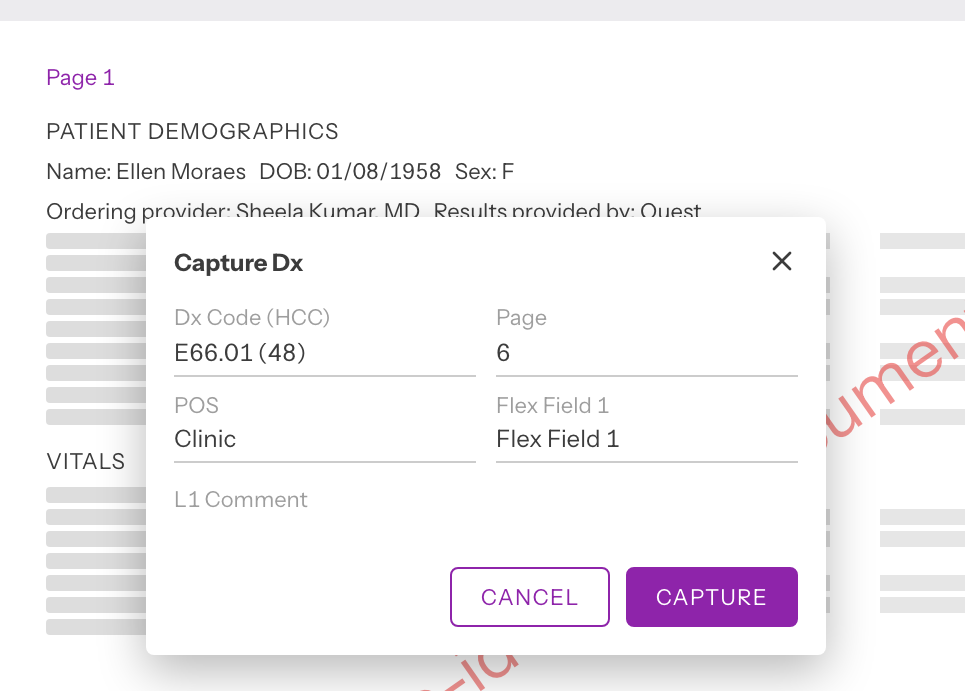
Judgment. Does this evidence support this diagnosis? In V1 the capture pop-up covers the very page being judged.
Speed and accuracy only fight each other when both jobs share one surface. I started thinking the fastest interface is the one with the fewest clicks. It is the one that never asks you to think about the wrong thing at the wrong time.
HypothesisSeparate the jobs, and speed and accuracy can both rise.
Split the work
Move the work to the right person.
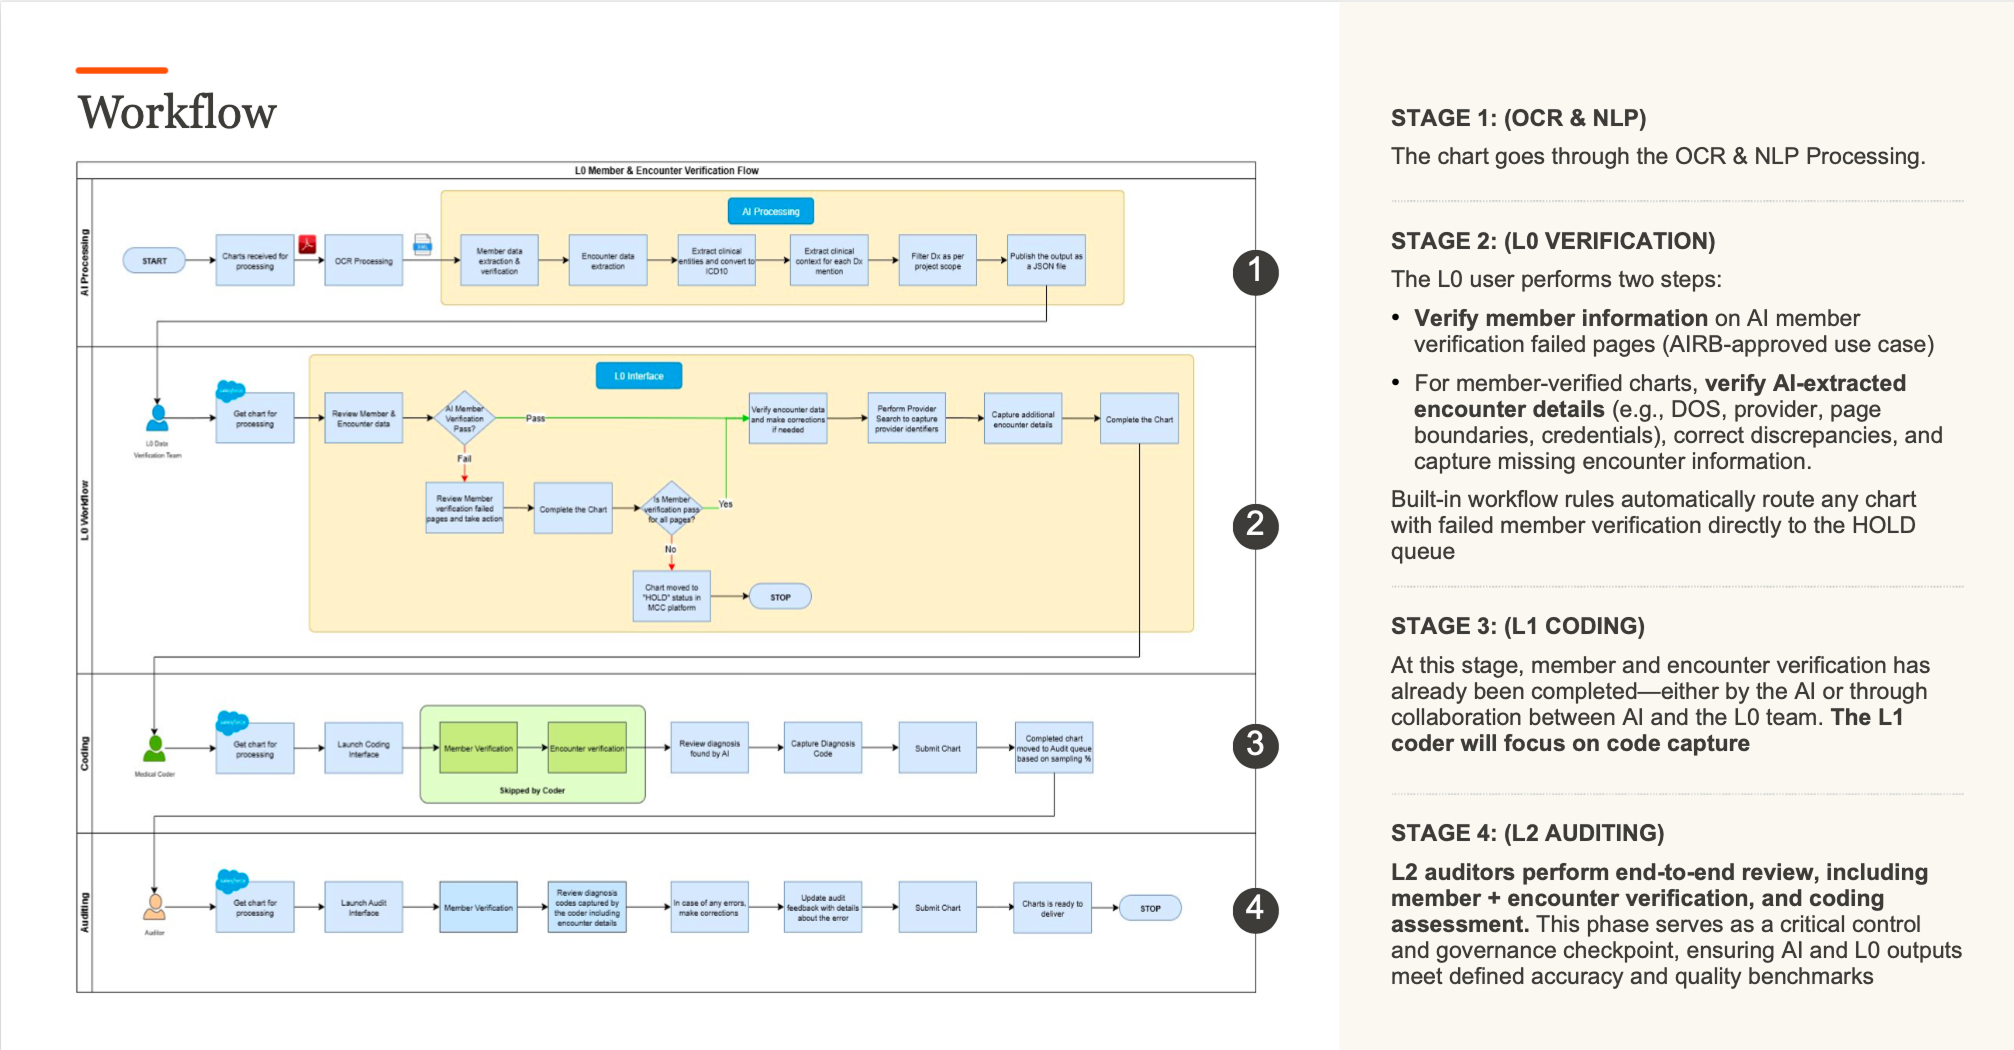
Instead of helping one coder do four jobs faster, the chart now passes through owners. Each lane receives only work the previous lane has resolved.
After: one chart, four owners
Transcribed from the original workflow slide below.
- AI processing
- AI reads the scanned chart and extracts patient, visit, and diagnosis data
- AI member check passes or flags pages
- L0 · Verification team
- Review only the pages the AI check flagged
- Identity fails → HOLD queueWith a reason such as “Patient DOB missing.” The chart stops before any coder sees it.
- Verify encounters: dates, pages, provider, credentials, signature
- L1 · Coder
- Member verification: skipped by coder
- Review AI-found diagnoses beside the source
- Capture codes and submit
- Audit
- A sample of completed charts receives an end-to-end review
See the original workflow slide
The green area marks the checks a coder skips after preparation.
- Decision
- Split verification (L0) from coding (L1).
- Rejected
- AI hints inside the existing flow, with every responsibility still on the coder. It was the path of least resistance.
- Why
- Verification is a different skill from coding. Making one person faster at both still keeps them switching.
- What it cost
- Two tiers, a handoff between them, and a dedicated L0 team.
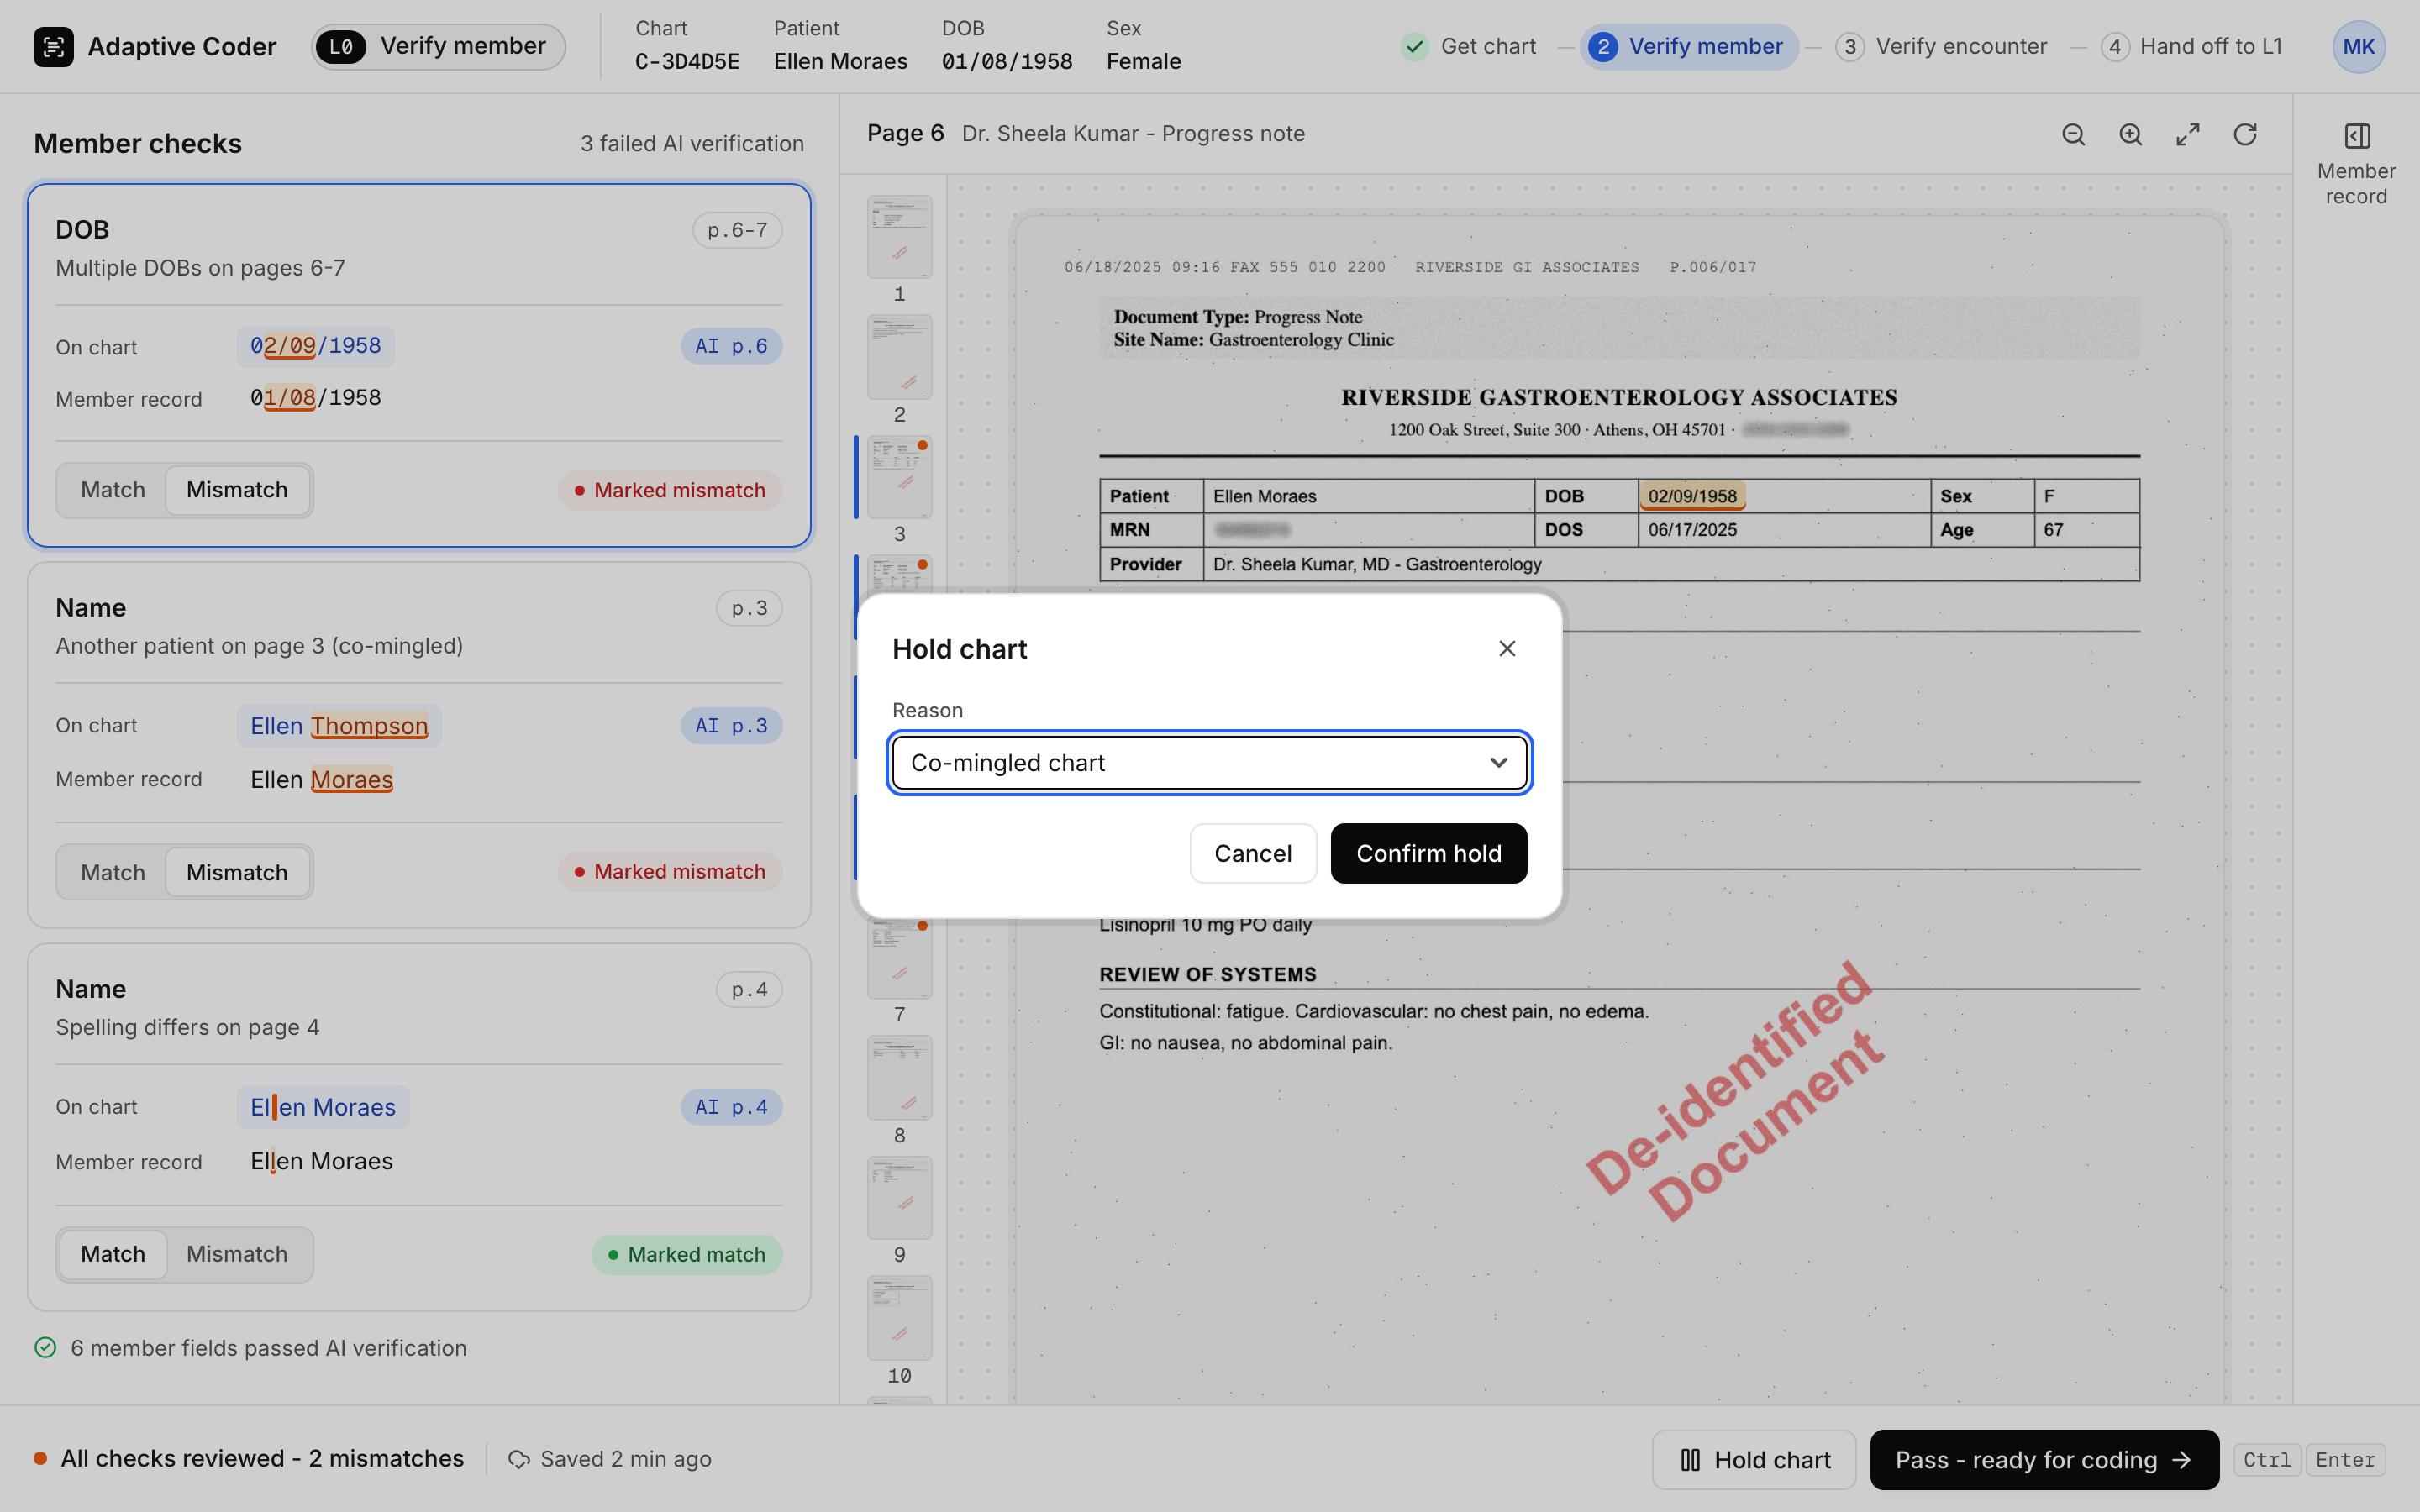
L0 sees only what the AI couldn't confirm. When identity fails, the chart stops there.
L0: failed checks only, and a way to stop the chart
Look at: the red mismatch rows and the Hold dialog. Three checks need a decision; the six that passed collapse into one line. A chart that mixes two patients (co-mingled) goes on hold with a reason and never reaches a coder.
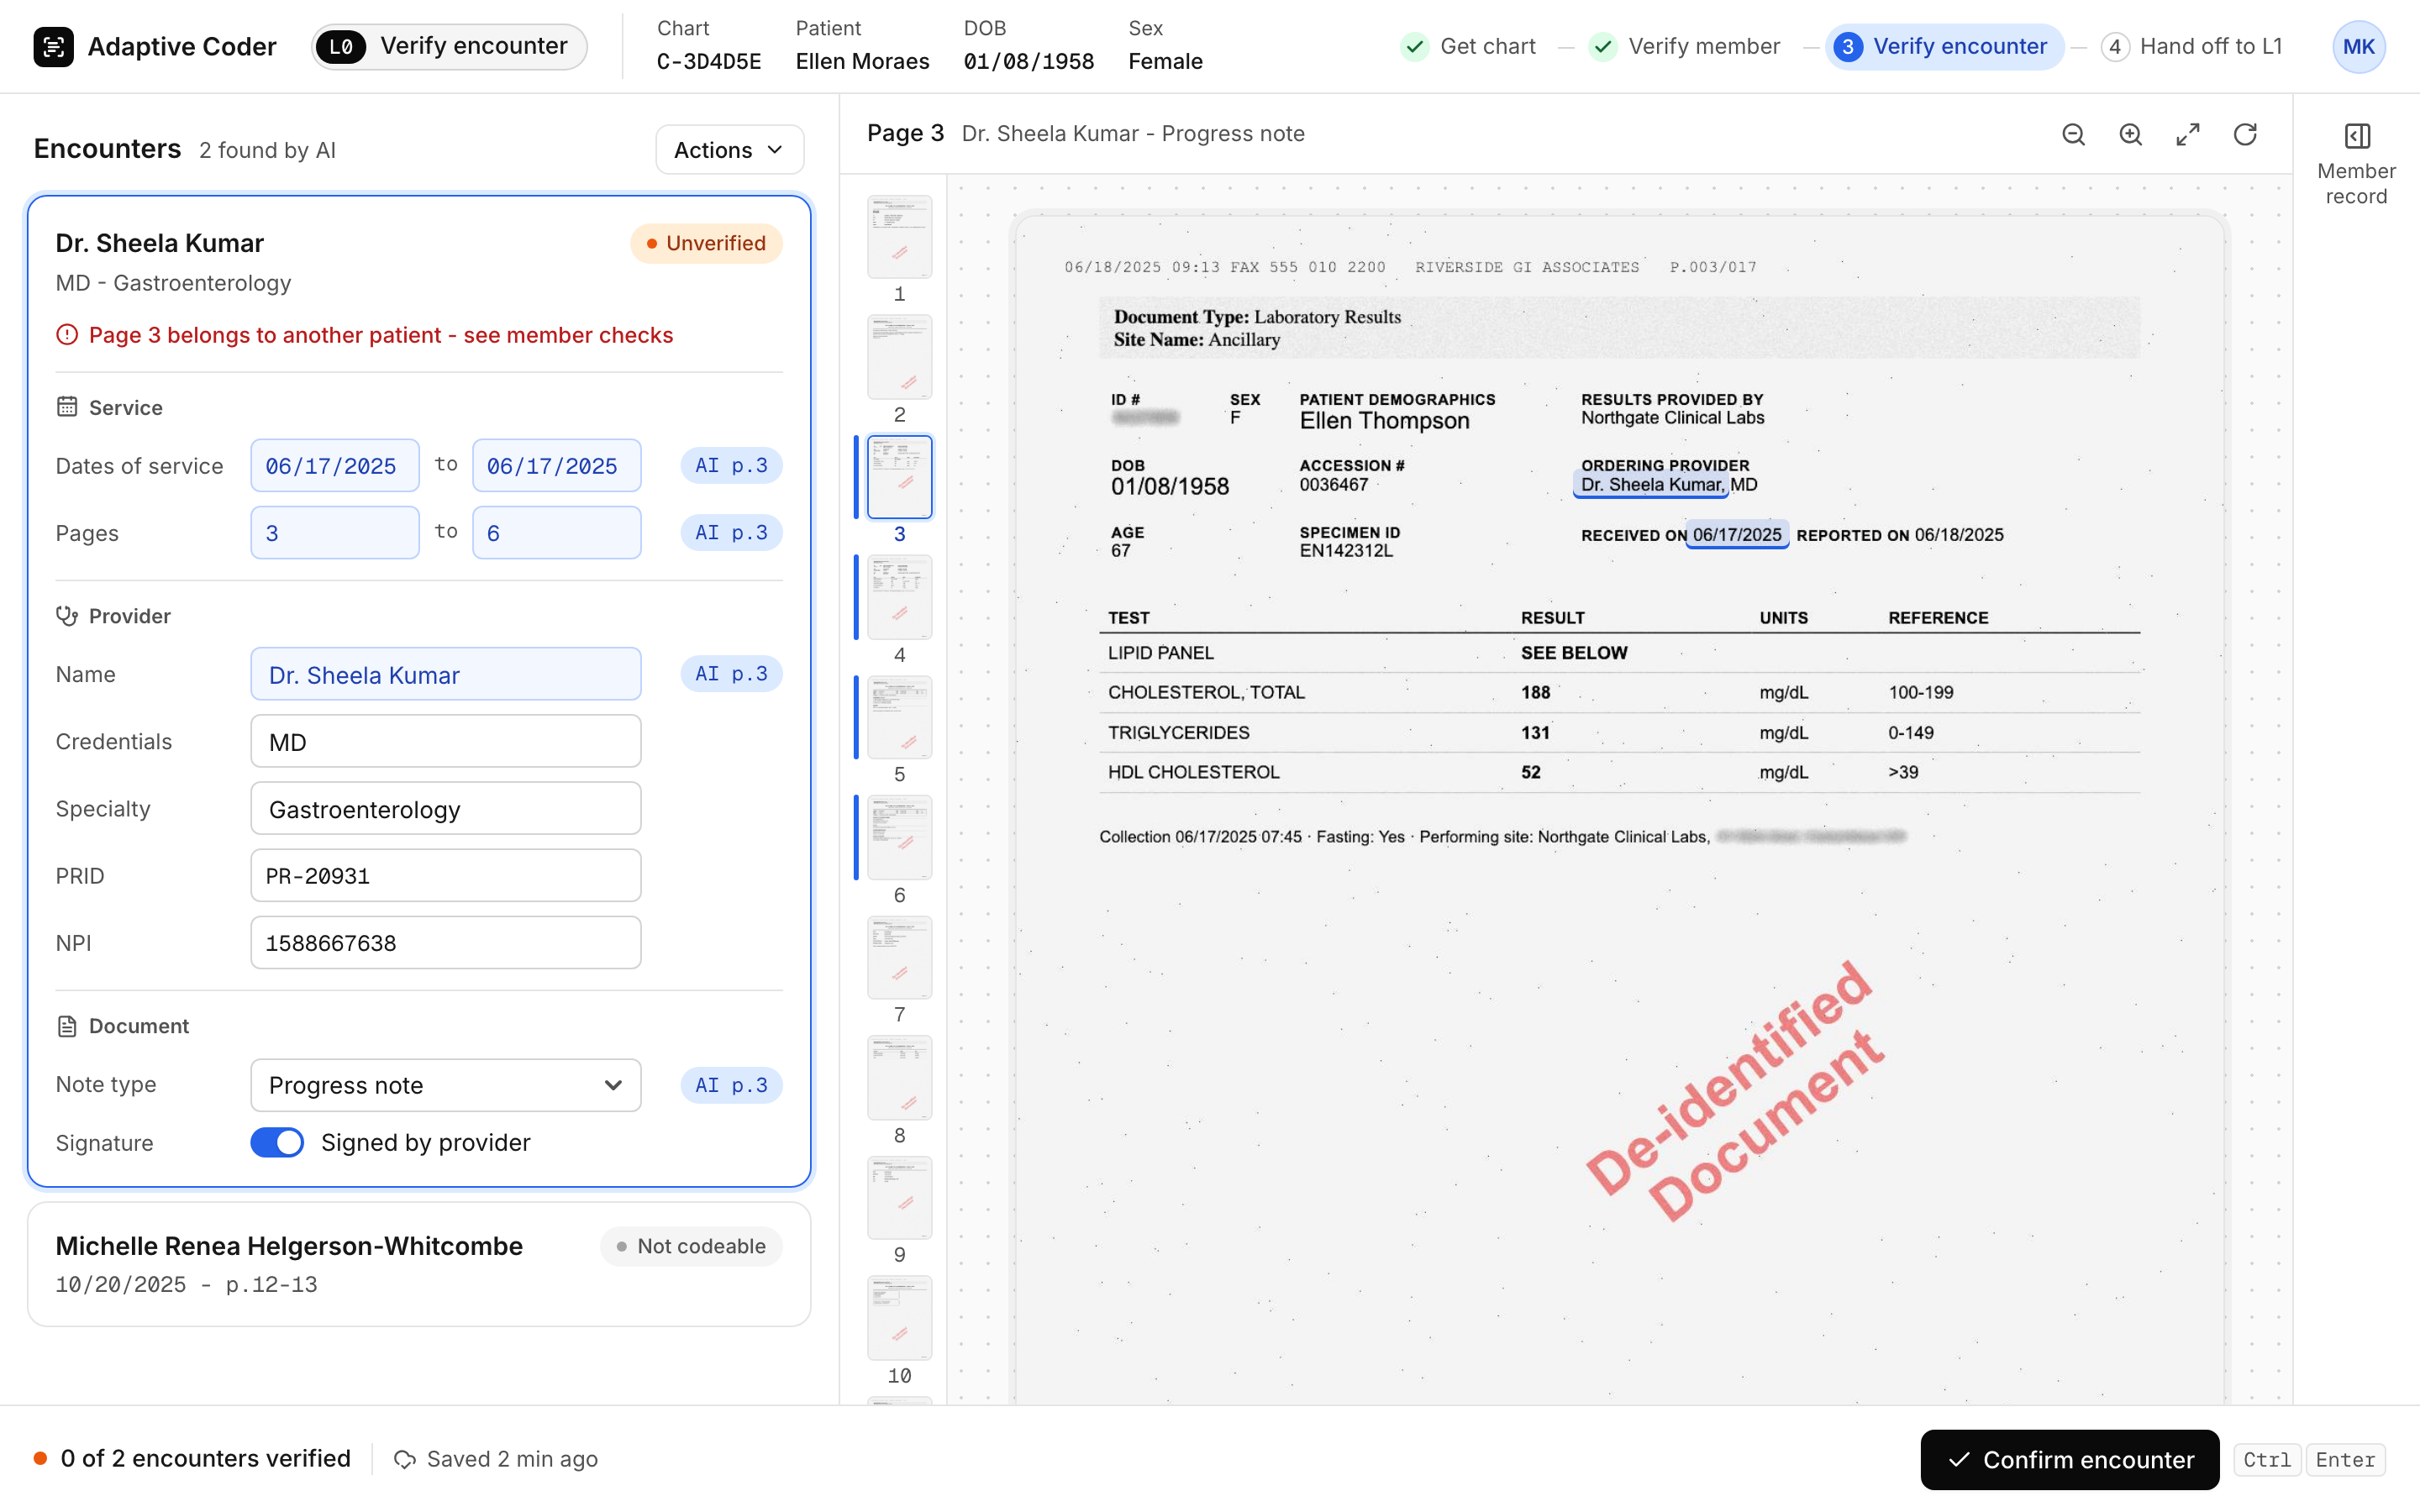
The AI that reads the chart (NLP) can merge visits incorrectly, miss information, or extract the wrong provider details. A polished interface should not make an uncertain extraction look like established truth.
So every AI value names its source page, and nothing moves on until a person confirms it.
AI suggests, a human confirms
Look at: the "AI p.3" tag on each field, meaning the AI filled it from page 3. The visit stays Unverified until L0 presses Confirm encounter.
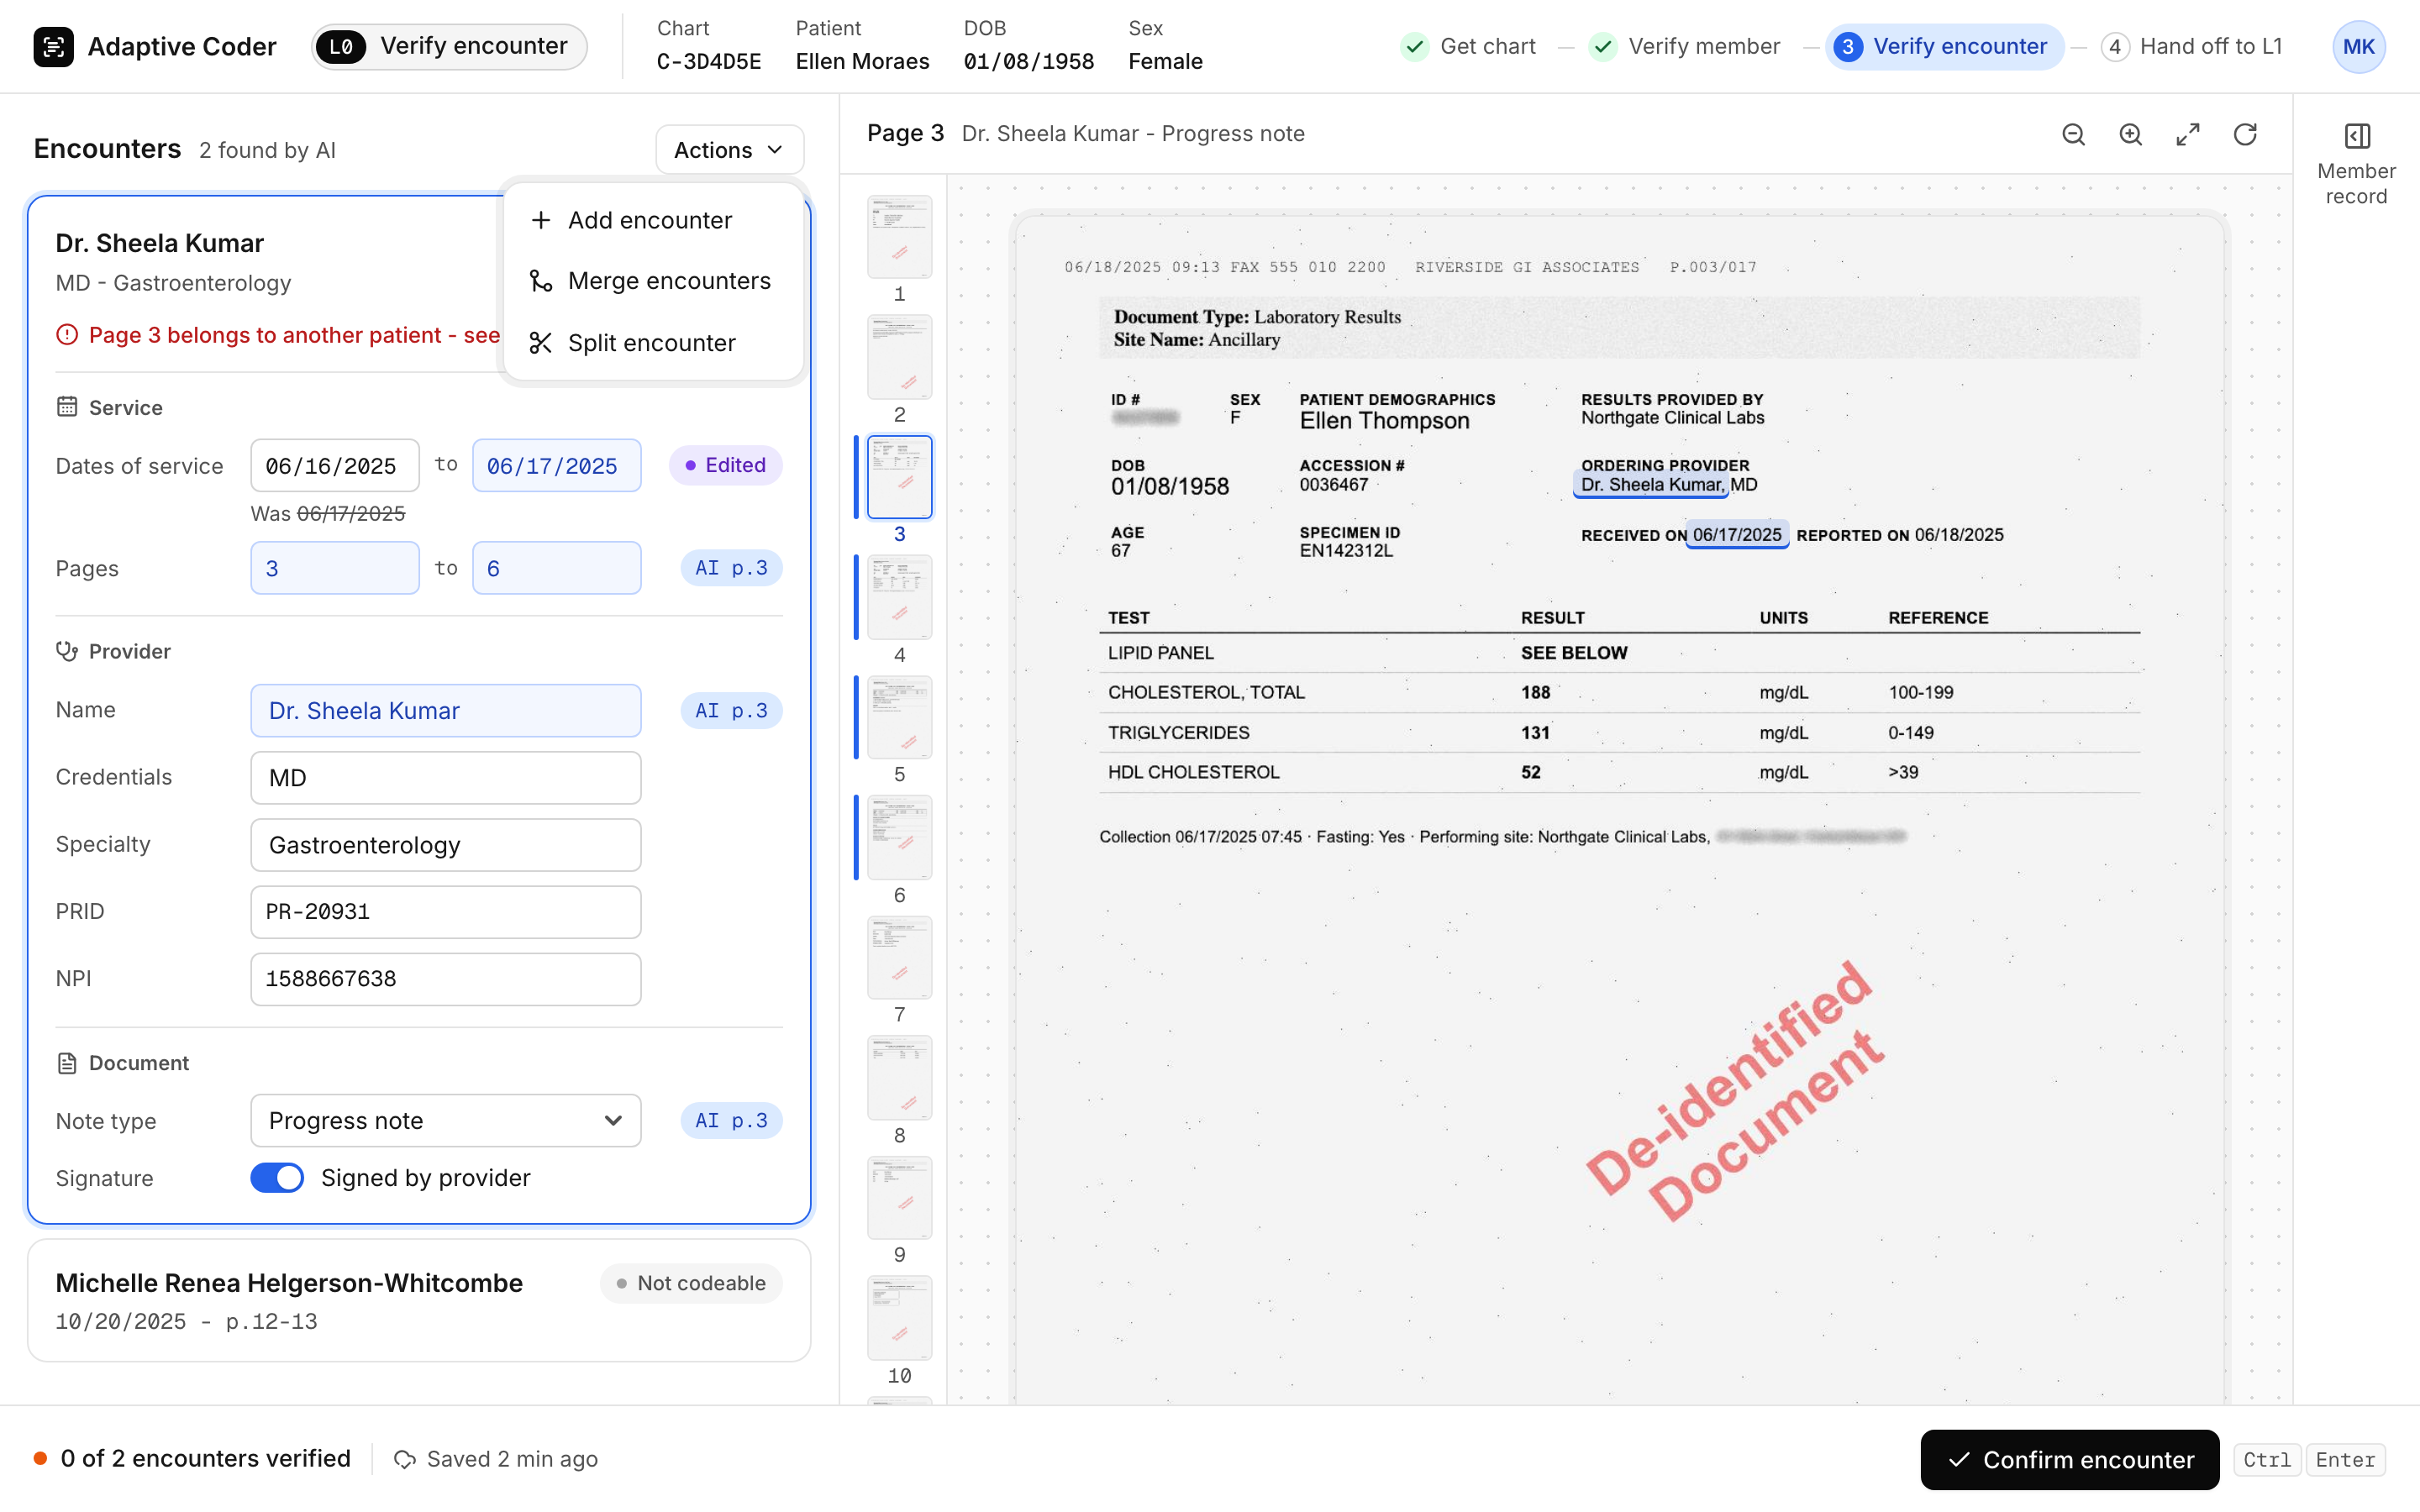
When the extraction is wrong, L0 fixes it at the source. The correction toolkit (confirm, modify, merge, split and add) makes an imperfect extraction recoverable before it reaches a coder.
The correction toolkit
Look at: the Actions menu (add, merge, split), the date marked Edited with the AI's original kept ("Was 06/17/2025") so the coder downstream can see what changed, and Confirm encounter at the bottom right.
Where I pushed
Operations pushed back: every chart would now wait in an L0 queue, and turnaround could slip. I made three arguments. Coder time was the bottleneck, with 66% of it spent on work that wasn't coding. L0 reviews only the pages the AI flags, so the queue holds exceptions, not every chart. And Phase 1 ran as a controlled pilot, so Operations could watch turnaround before a full rollout.
Where I pulled back
Coders had years of V1 habits, and I didn't want to disrupt them completely. The legacy Chart History view stays available through a toggle, and the snippet view keeps the full page one click away.
The design decision was who should do the work, before it was how the screen should look.
L1 coding
Keep the evidence beside the decision.
With verification moved out, the L1 screen could serve one job. Coders cross-reference constantly while capturing a diagnosis, so capture, the source and reference material sit side by side.
L1: the chart arrives prepared
Look at: the green banner. Everything below it was already checked, so the coder only judges diagnoses.
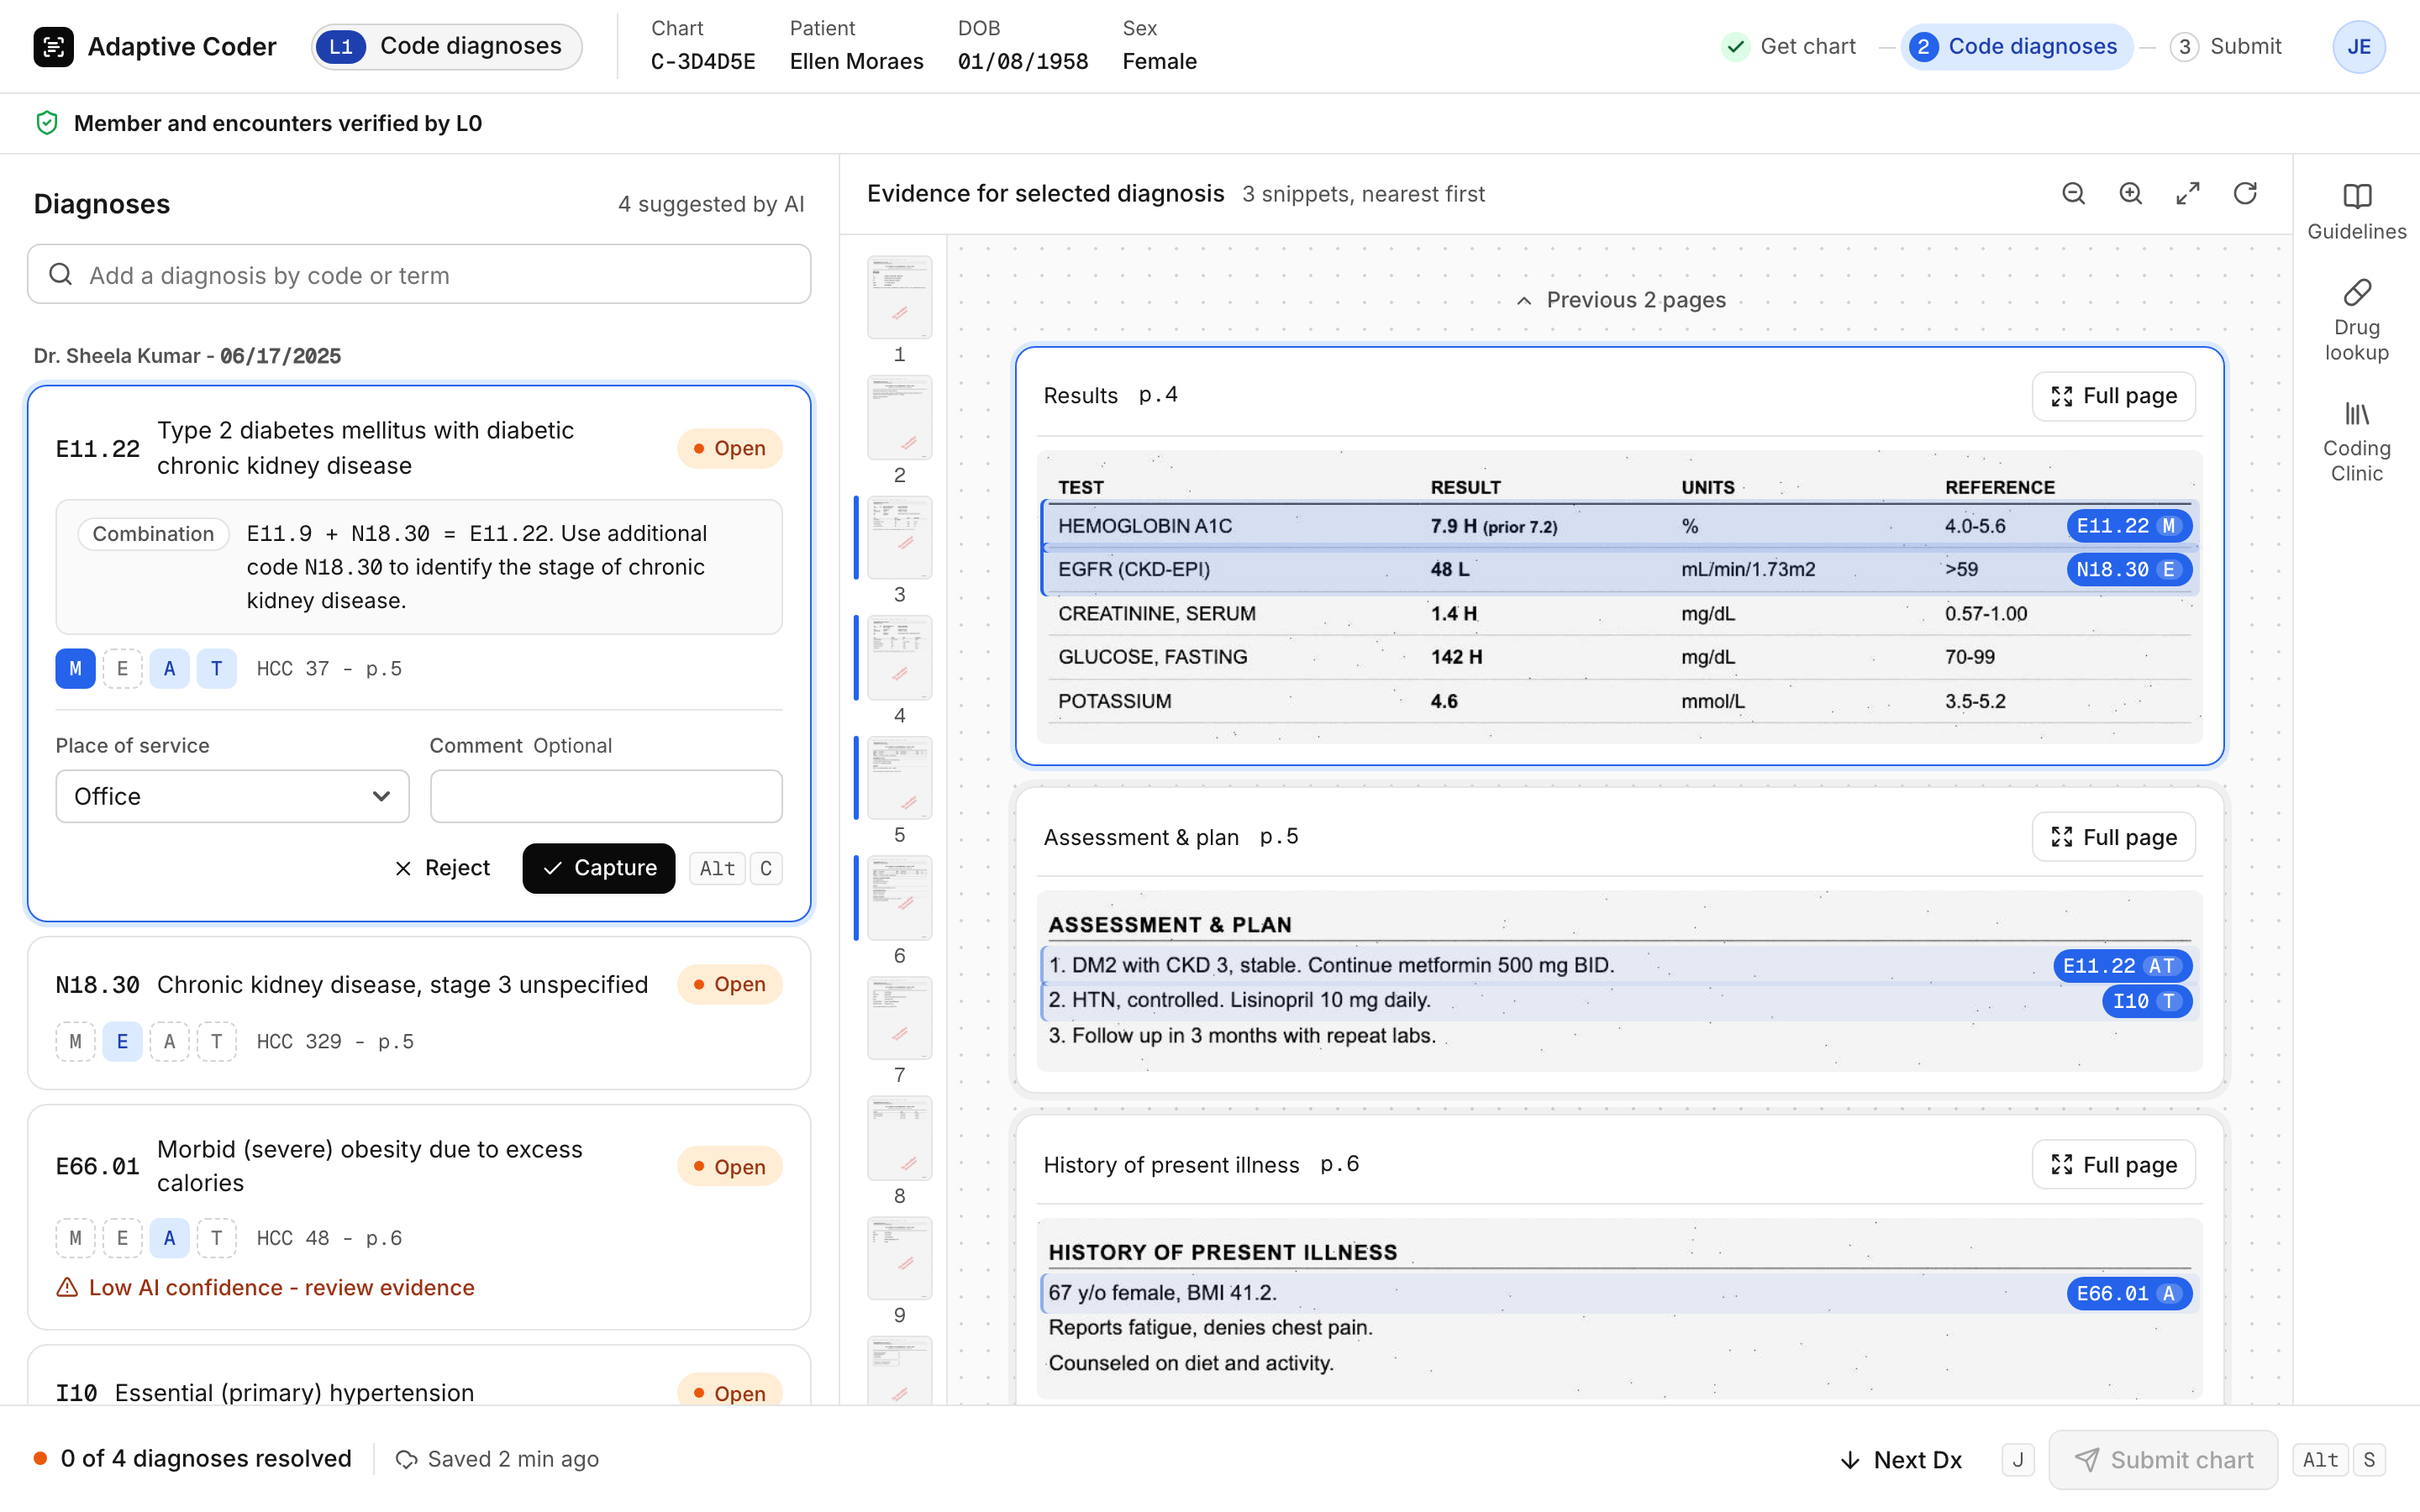
- Top banner: member and encounters already verified by L0.
- Right: evidence snippets, nearest first, each with a Full page escape.
- Left: the diagnoses, with codes that combine into one spelled out (E11.9 + N18.30 = E11.22), and MEAT chips showing which kind of evidence supports each code. Expanding MEAT references was the top request in the coding alpha.
- Decision
- Three panels, always open: capture, source, reference.
- Rejected
- Click to Code pop-ups, tabs, or modals that hide the source while the coder decides.
- Why
- A coding decision depends on the passage that supports it.
- What it cost
- The densest screen in the product, and later its lowest-rated item: 74% for the three-panel layout.
- Decision
- Collapse reference panels by default and let coders resize the diagnosis panel.
- Rejected
- Keeping three dense panels open at all times.
- Why
- The three-panel layout was the lowest-rated item in the coding alpha (a 20-coder early test of the coding screen), at 74%. This revises the three-panel decision above: less on screen by default.
- What it cost
- References sit one click away instead of always in view.
The decisions, in 48 seconds
The rebuilt screens in motion: V1 first, then L0 and L1, with each decision named as it appears.
Three flows
Each clip plays one screen from start to handoff.
L0 member check
Show only what failed. The verifier sees the checks the AI flagged, not every field.
L0 encounter check
AI suggests, a human confirms. Every AI value names its source page, and edits keep the original.
L1 coding
Capture without hiding the chart. The diagnosis is captured beside its evidence, with no pop-up.
Human + AI
Make the AI useful. Keep judgment visible.
L0 confirms every AI value before it moves on, and L1 coders see what was checked and what still needs them. When verification is partial, the banner names the exact pages.
Partially verified, with the pages named
Look at: the amber banner. It names the conflict (date of birth, page 6), and the diagnosis card points to the same page. Suggestions the AI is unsure about are flagged too.
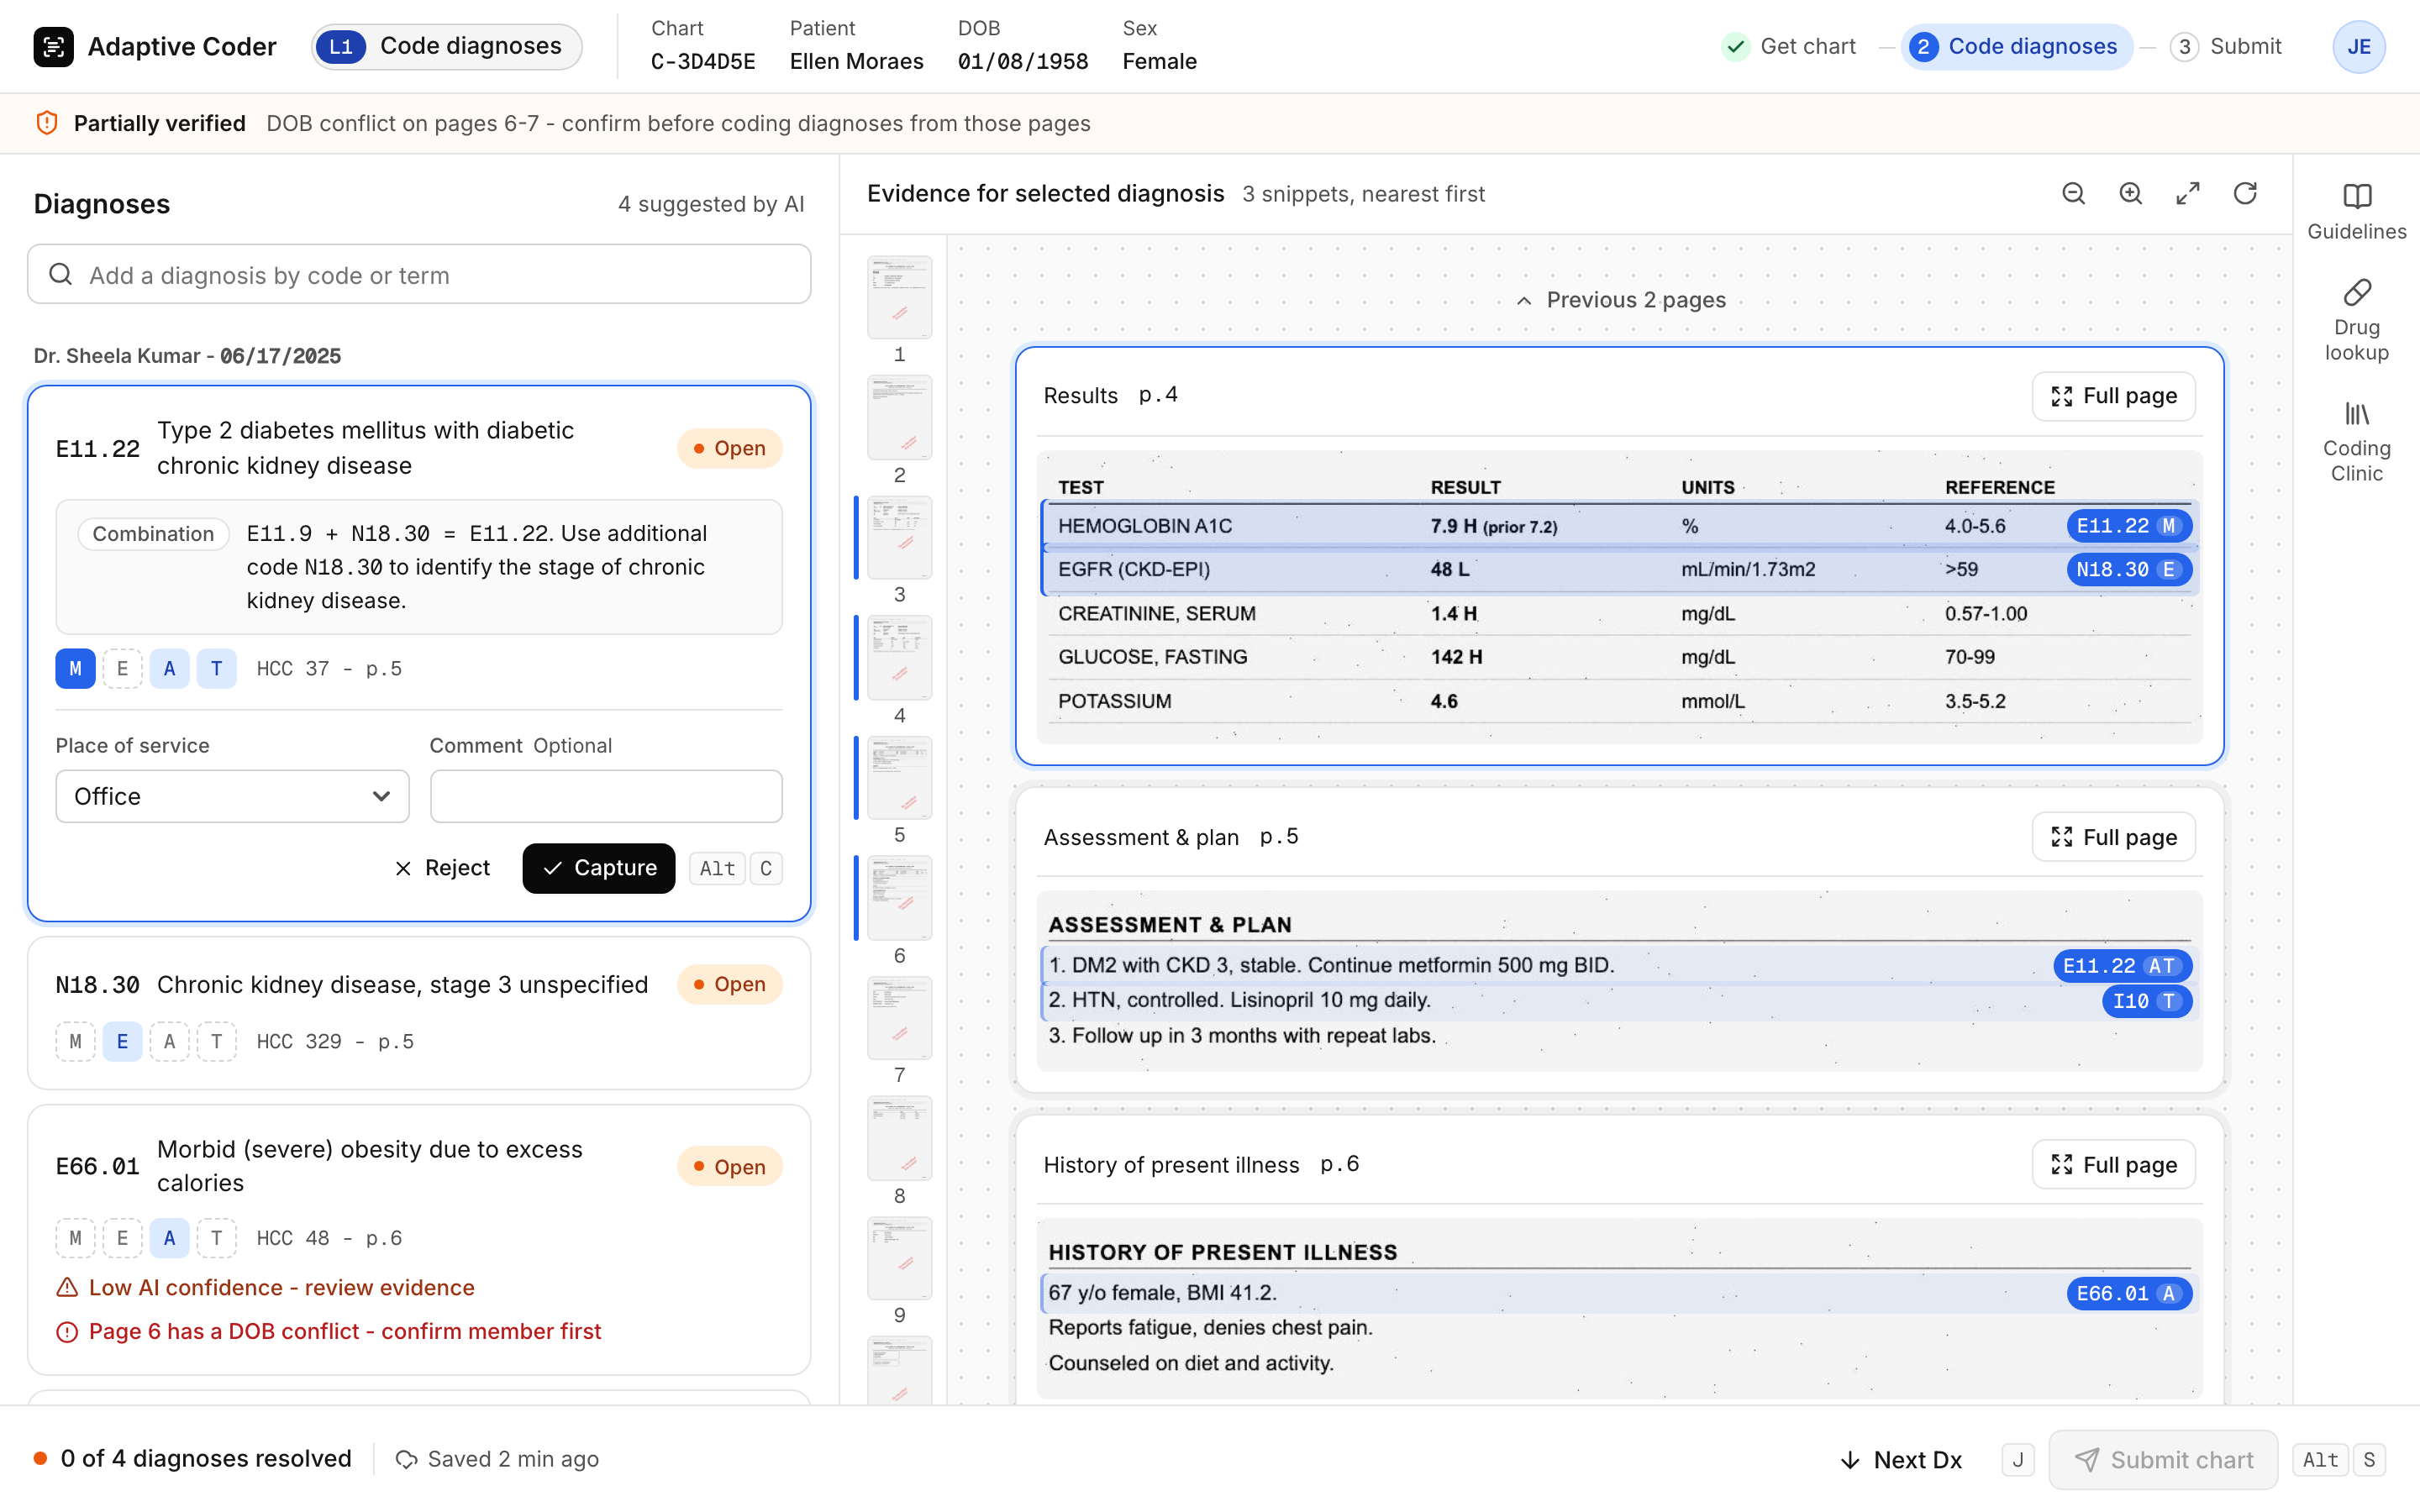
Member verification pilot, n = 88787.4% said the Partially Verified alert helps them identify flags quickly. 89.4% found outcome alerts clear. In open comments, coders praised the exact page numbers.
- Decision
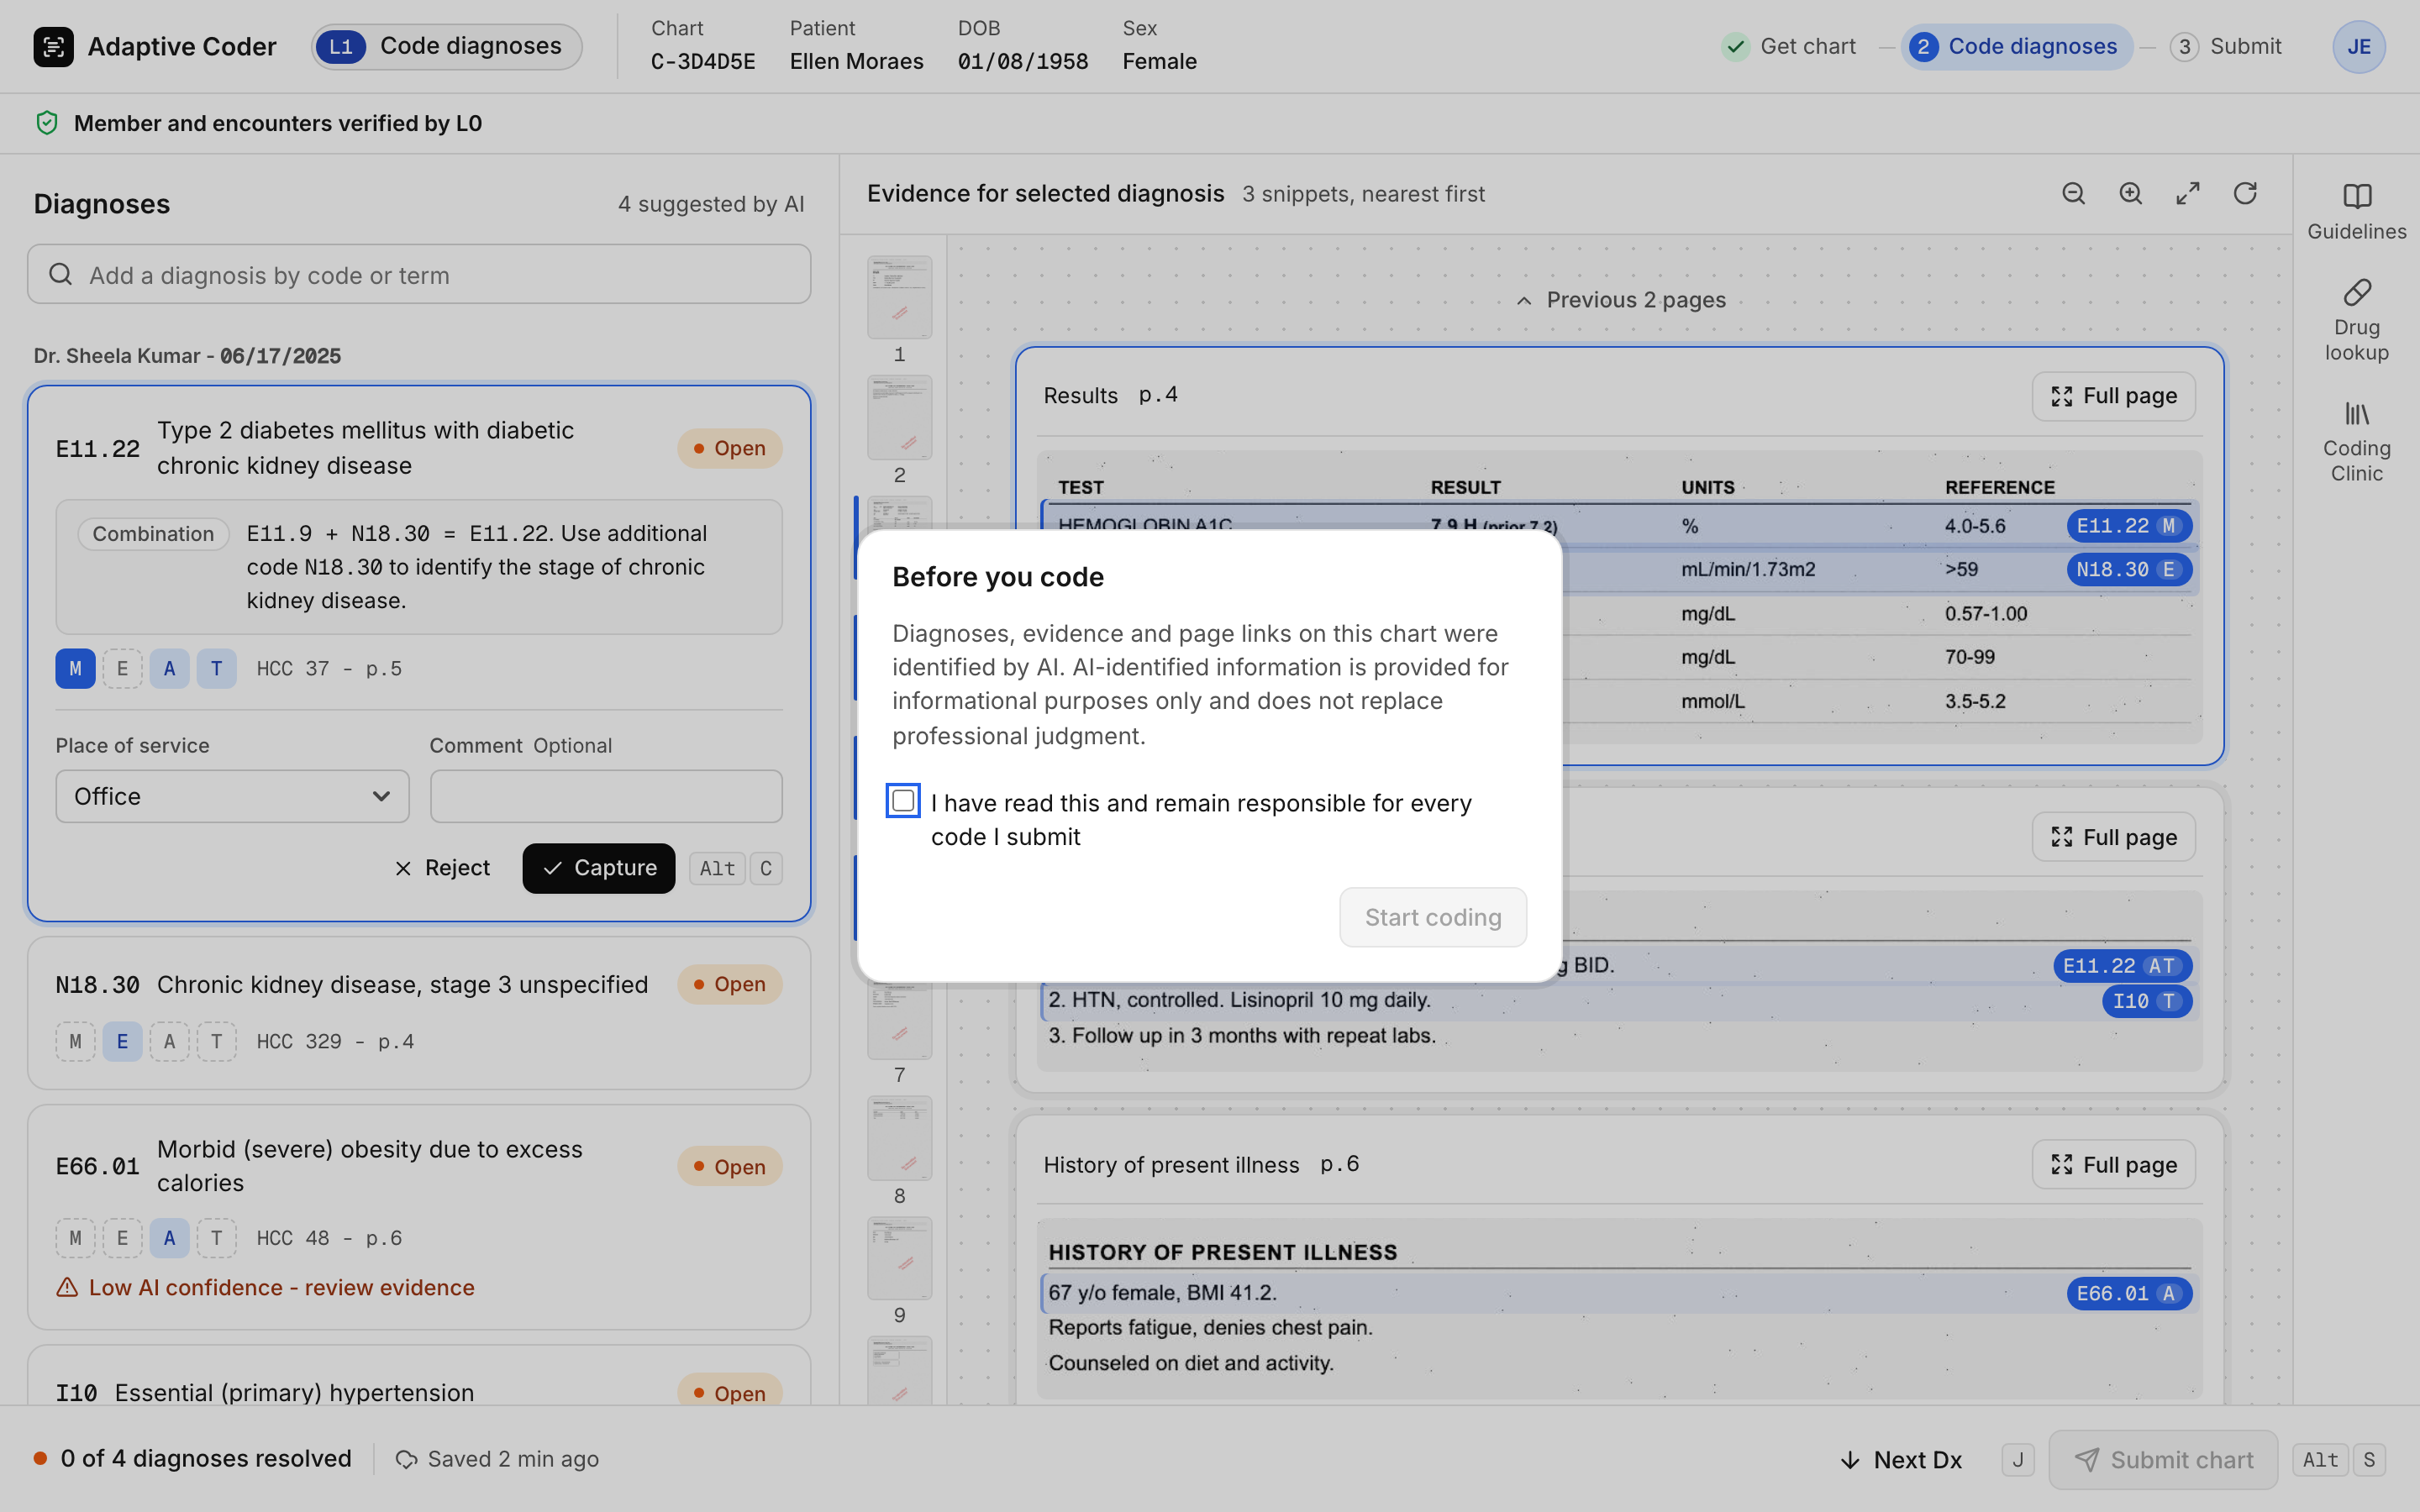
- Disclose the AI, and require an acknowledgment before coding.
- Rejected
- Silent AI, or AI shown only on request.
- Why
- Coders stay responsible for the code they submit. They need to know which parts a model prepared.
- What it cost
- One extra click on every chart, accepted as deliberate friction.
The acknowledgment gate
Look at: Start coding stays disabled until the coder ticks the box. The text names what the AI prepared and who stays responsible.
Evidence
Strong signals, kept apart by source.
I designed and analysed the surveys. Two studies answered different questions with different participants, so their numbers stay separate. Feature effectiveness is the average share of positive answers across a survey's questions.
| Source | Sample | Result |
|---|---|---|
| QA checks | 30,000+ charts coded during the pilot | Near zero errors, from the pilot and random observation of coders |
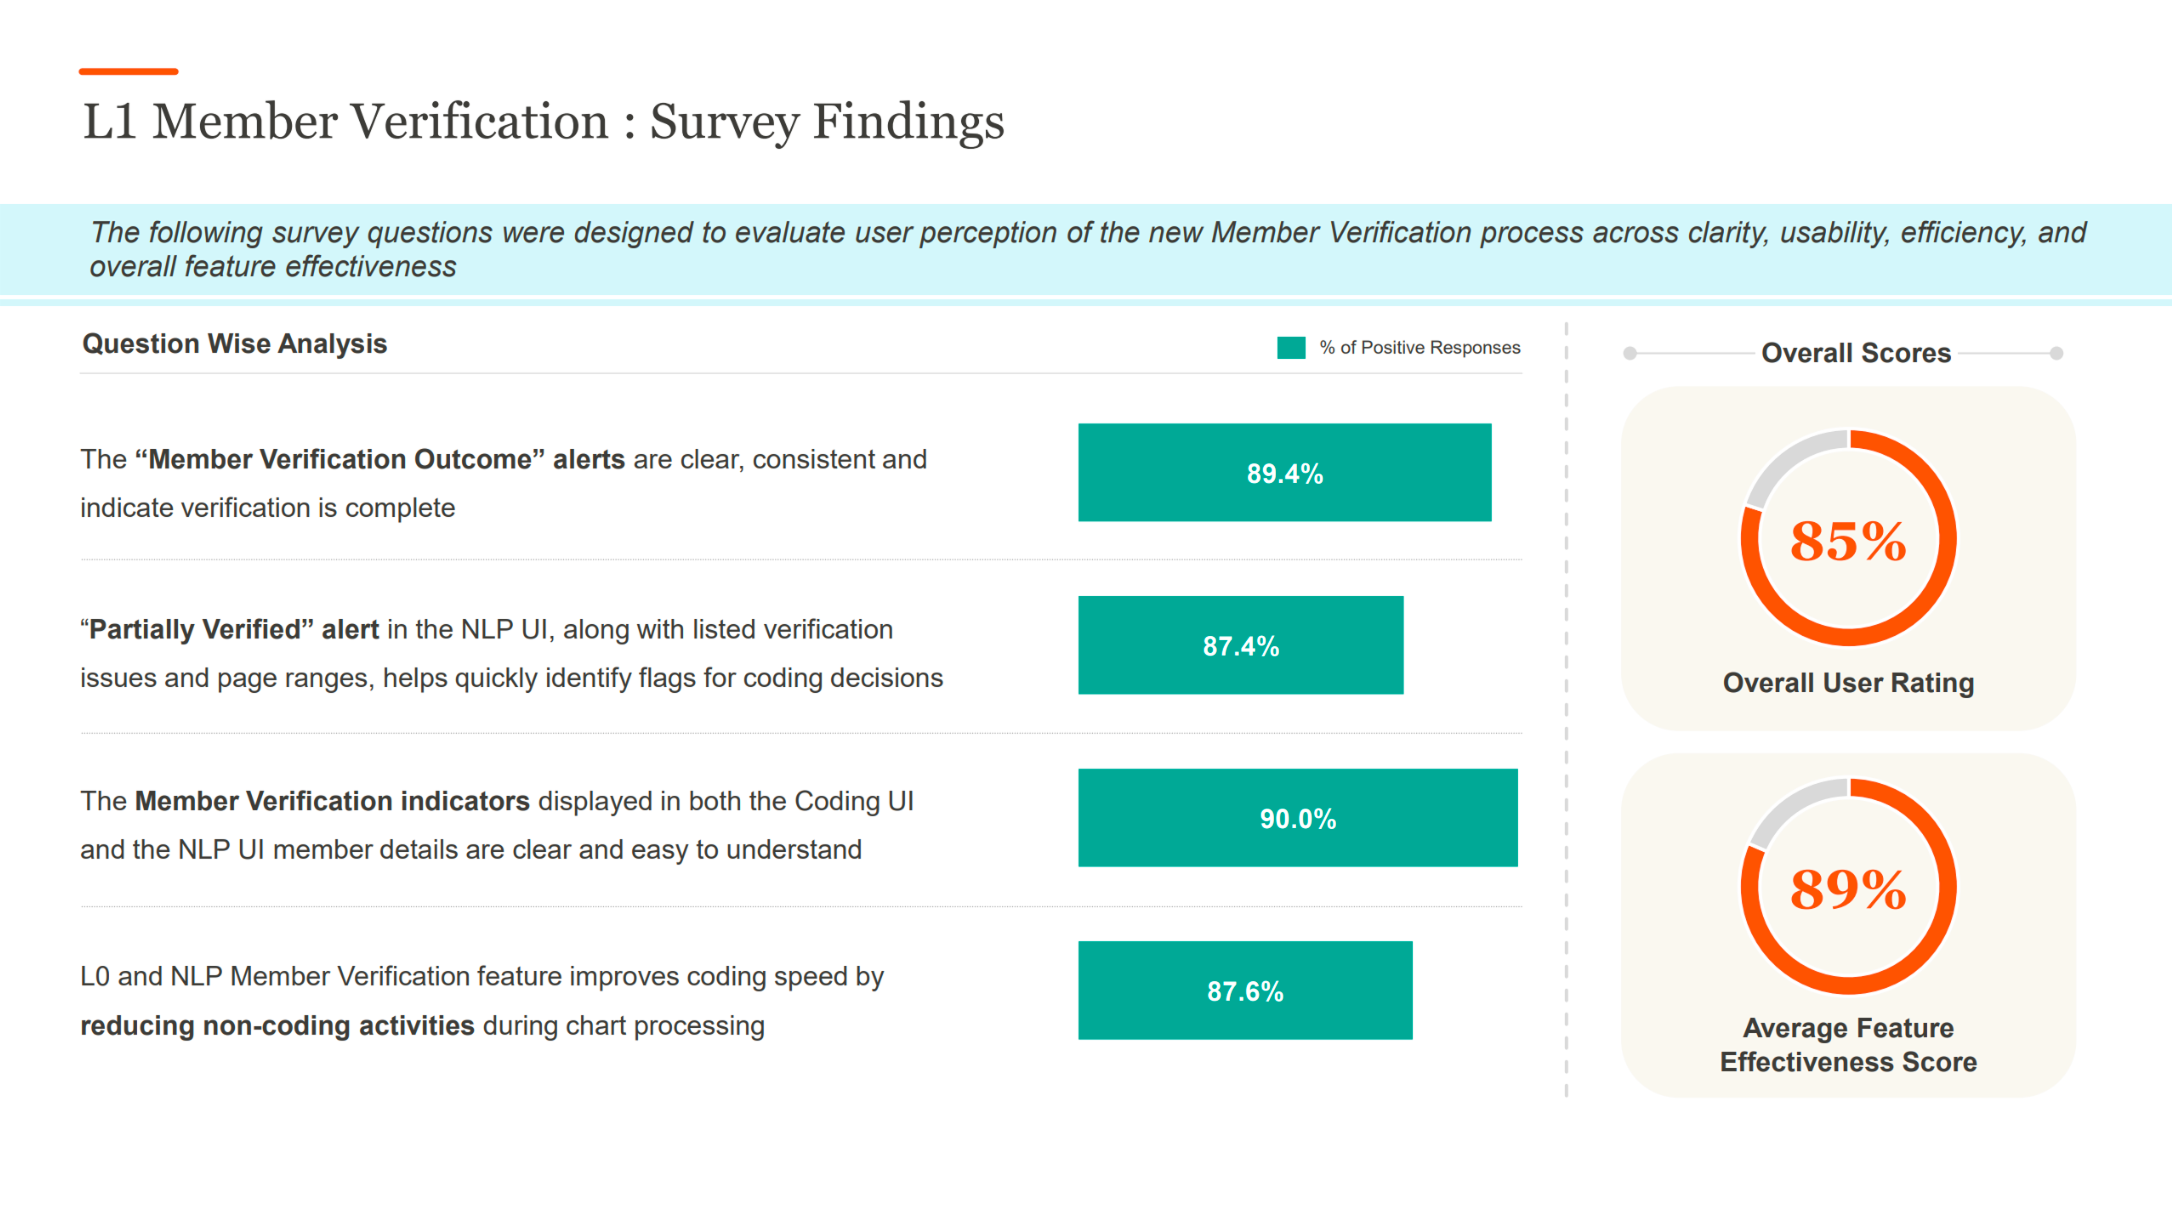
| Member verification pilot | n = 887 | 85% overall rating. 89% average feature effectiveness. 90% found indicators clear. 87.6% agreed “L0 and NLP Member Verification improves coding speed.” 89.4% found outcome alerts clear. |
| Adaptive coding alpha | n = 20 | 80% overall rating. 88% average feature effectiveness. 100% said pre-verified details help. |
Member verification pilot, original slide
887 participants. Key results are in the table above.
Coding alpha, original slide
20 participants. Key results are in the table above.
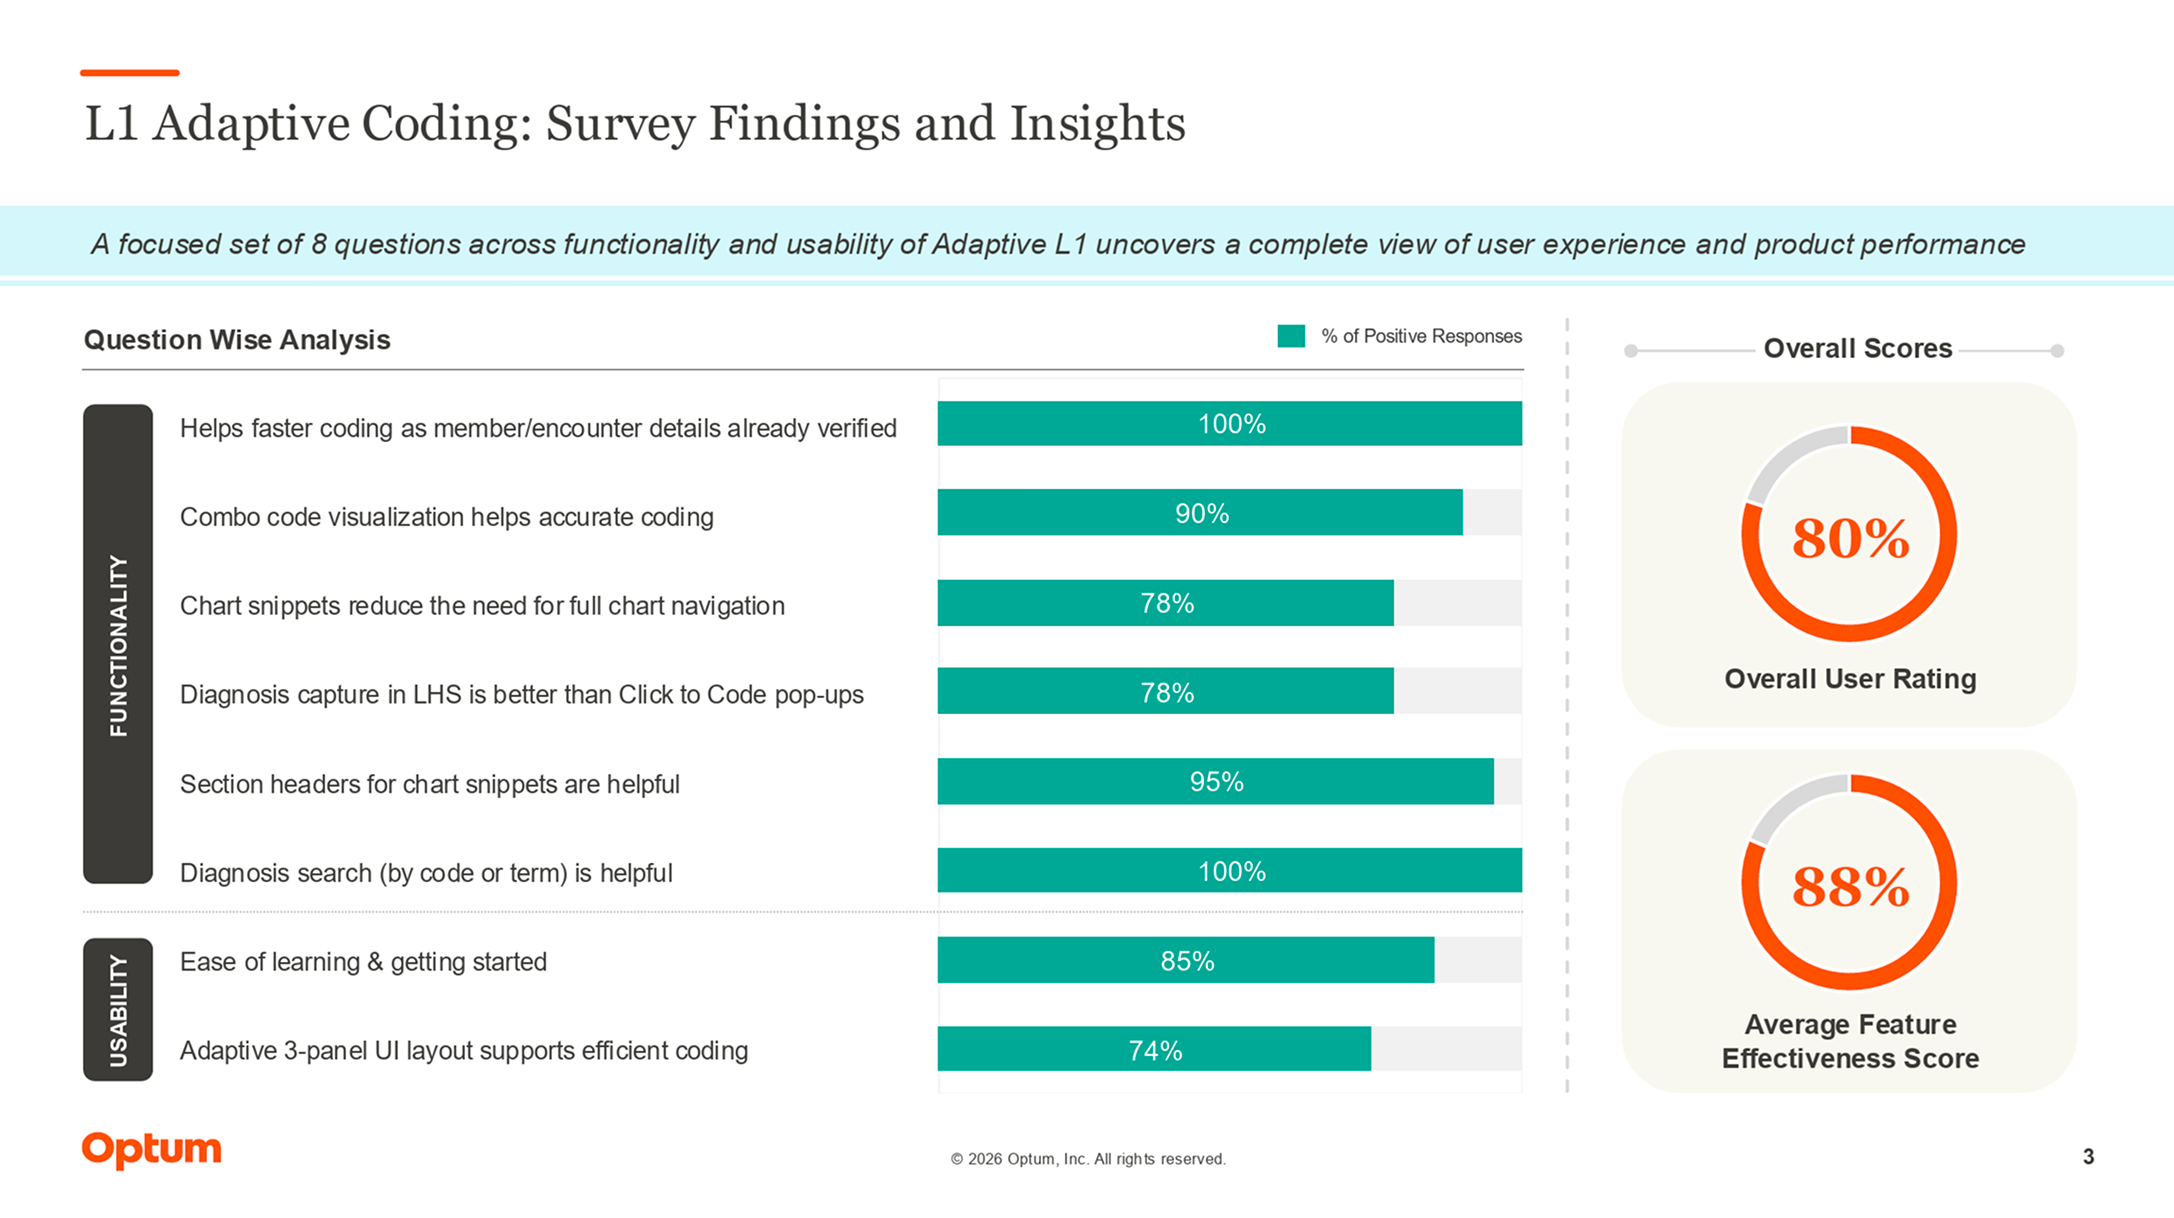
What these results don't claim. The 66% baseline comes from the business case, not my measurement. Survey ratings are not instrumented throughput. The QA figure comes from the pilot and random observation, not a full audit, and is not a guarantee of future accuracy.
Reflections
What I learned, and what's next.
Fix the workflow before the screen.Watching coders work showed the real cost was who did each step, not how the screen looked. Moving work to the right person did more than any redraw could.
More visible isn't more usable.Showing everything at once was meant to save clicks. The 74% layout score says it cost attention instead, which is why the reference panels now collapse by default.
Trust comes from recovery, not disclaimers.The acknowledgment tells coders the AI was involved. The correction toolkit is what lets anyone fix it when it's wrong.
What I'd do differently
Build measurement into the design, not after it. Surveys and QA showed the split worked. Time per chart, logged by the tool itself, would show how much it worked.
What's next
Measure the revision. Re-survey the layout now that reference panels collapse by default, and log time per chart in the tool itself.
Good AI interaction starts with a clear division of responsibility.